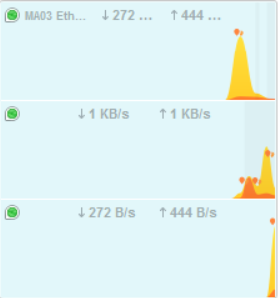
1. The order of the mini viewer graphs appears to have changed.
I noticed this when I turned the mini viewer on after not using it for a month or so.
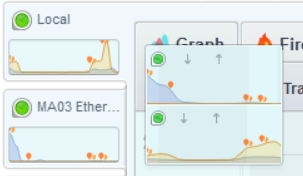
I’m certain that the order used to be the same as in the main window although I didn’t have any old screenshots to confirm this. The Local graph is at the top and the other graphs are below it. Now the Local graph in the mini viewer is at the bottom.
Whether or not I am correct about the change - I’m sure I would have noticed before - it is confusing to have a different layout in the mini viewer than in the main window.
I know that the correct labels can be displayed by expanding the mini viewer window but I don’t want more screen space to disappear.
This also highlights another issue.
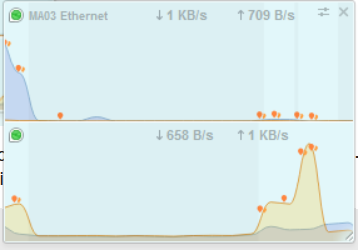
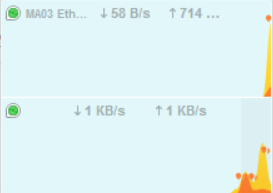
2. I can’t find where to add a name for the Local client.
It is currently blank in the mini viewer but the GlassWire feature list shows a mini viewer window with each graph named:
3.The up arrow and down arrow don’t do anything when the windows is small. It would be better to display the computer name once the bandwidth numbers are no longer displayed.
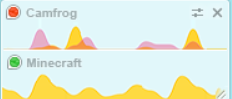
4. I have three Mini Viewer views for two computers (both using 1.2.64b) because there are two views of the local data.
I don’t think that this is a new feature:
It is showing three views:
MA03 remote server 3 Hours graph
Local graph for the currently selected view
MA03 remote server for the currently selected view but not labelled correctly
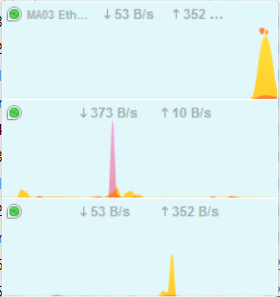
I changed the current view for the Local and remote server to 1 Month to show how the Mini Viewer views change:
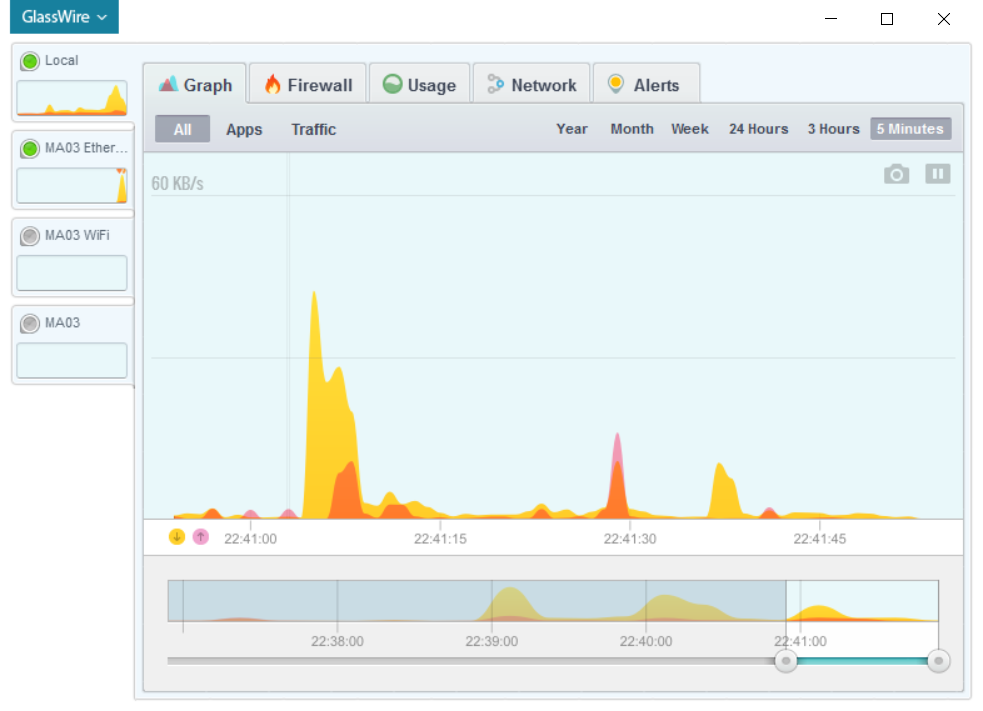
For reference, here is the main GlassWire window for the top image: