Hi,
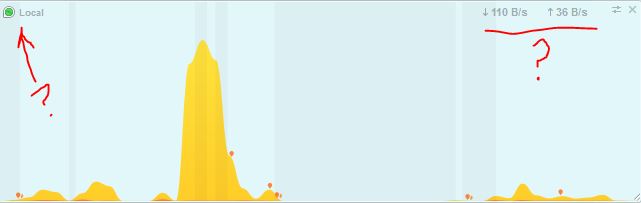
On my MiniGraph view the word “Local” appears in the upper left corner and numbers indicating down and upload bandwidth are in the upper right corner. I presume they represent Local Network values. Can these numbers be changed to represent External traffic or combined traffic? I cannot figure how to do that, if it is possible.
The data on the mini graph is your total bandwidth exactly like on on the main GlassWire graph. “Local” means you are looking at your local PC bandwidth data as opposed to a remote PC you are monitoring remotely.
Sorry to ‘necro’ this thread, but I can’t help myself: Why not leave it blank when not needing to differentiate between graphs? Because I had to hunt down what Local meant as I assumed it meant it was showing me LAN-only traffic. Just a suggestion!