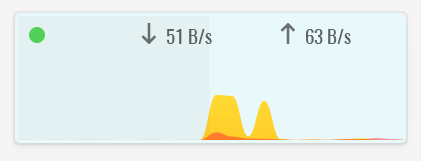
The Mini Viewer is barely usable. It can’t be customized (except themes), speeds text in the top right corner are small, pale, and don’t represent the chart height but the current traffic speeds. So the mini viewer is a chart with buttery smooth animated curves and a barely visible set of current speeds. Since most of the time the DL/UL speeds are fluctuating, they don’t offer any info on what is drown on the chart.
Also - no resizing of the window, only scaling?! Really?
I was excited by the potential of GlassWire, but the mini viewer is a must have for me. I found other people feature requesting (links below) more customization options for it, but nothing so far. And this is a paid feature?!
After using the software for a few days, I found that GlassWire greatly favors design over function. This is a good ting sometimes, but not in a network monitoring tool.
forum. glasswire. com/t/future-feature-requests/5350/4
forum. glasswire. com/t/text-on-mini-viewer-is-barely-visible-for-me/5272/9
p.s.
The main chart needs attention too.
1 Like
@tcvetkov
Thanks for your feedback. We will work to improve the mini viewer in the future. There may be a couple misunderstandings that I wanted to point out, but perhaps I myself am not understanding you properly? If so I apologize.
First of all, we let the user control exactly what appears on the graph by setting up the main GlassWire window. Whatever is on your GlassWire graph and however it’s set up should match the mini viewer. The mini viewer is mini and has limited space, so we thought matching whatever is on the graph (that has a lot of customization) would be the best solution.
Scaling GlassWire
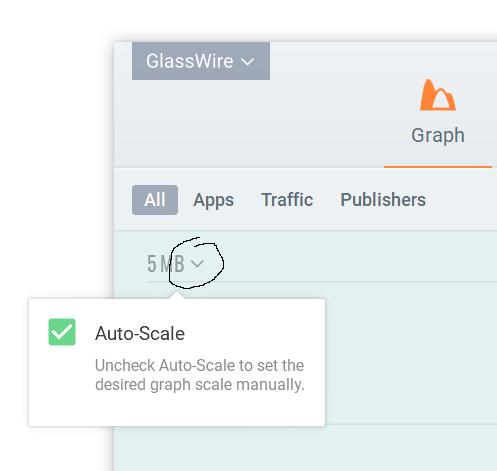
GlassWire does have scaling. Click the small arrow at the top left to scale it however you want by disabling auto-scaling. You can then scale GlassWire however you prefer. If you are missing this feature you may be using an old version of our app.
The scaling view you choose here should appear on the mini viewer and match it exactly.
Resizing the mini viewer window
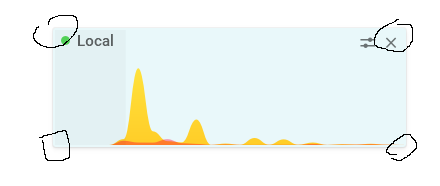
The mini viewer also allows resizing. Mouse over a corner of the window to resize it, then your cursor will change and you can drag the window larger similar to any other window in Windows.
We work hard on our user interface improvements. Recently we made the following changes due to user feedback:
- A user reported a part of the app had a blurry font. We recreated this issue and fixed it in our latest version.
- In October we made scroll bar improvements posted here that were requested by GlassWire fans.
- Again in October we fixed an issue that could cause our icon to appear blurry in the tray due to user feedback.
- We added completely new dark themes that are free for everyone.
- We are constantly improving and fixing translations due to user feedback.
- We added an animation that made it more clear when you’re switching between firewall modes.
You can view all our recent changes here GlassWire Software Version Changes List and I think you’ll see we really are trying our best to incorporate the reasonable most requested changes made by our users.
We will also discuss your post and consider your changes. Thanks for your feedback and I hope my post helped you with the scaling and making the mini viewer windows larger or smaller.
English is not my native language, so I will take the fault for the misunderstanding, although assuming someone don’t know how to resize a window is not cool. 
By ‘scaling’ I meant that resizing the mini viewer window is possible only maintaining the initial proportions - scaling the size. What I wanted to achieve is wider mini viewer, but not higher. The idea is too see more of the past without taking vertical space and without loosing detail.
The Auto-scale that you mentioned should be on the mini-viewer too. Because on the mini viewer X-axis is defined by the most right point (which is ‘now’) and the most left which is ‘now’ minus the time interval set in the main graph. Y-axis is defined by 0 (bottom) and what?
You said that the graph has a lot of customization. I want to do the following:
- Add a horizontal line which touches the highest peak of the curve and also has Y-axis value - this is something like the auto-scale value, but more precise.
- Pick custom colors for upload and download.
- Add at least 2 more horizontal lines with Y-axis values (KB/s)
- Like in the small time picker/sliders below the graph - add vertical lines on every minute (optional interval will be better) - this is much easier on the eyes than reading the small labels on the X-axis.
And most of all - I want to make the text a bit bigger and in contrasting color, so I can actually read something without touching the monitor with my nose 
Please let me know how to do these or point the docs/manual page with instructions.
Don’t get me wrong, I don’t mean that you don’t listen to user feedback. You probably do, but my issues with GlassWire were reported by other people long ago. I don’t think I expect some uncommon or weird features.
Best Regards!
Todor
1 Like
Hello again!
I don’t want to cause any trouble, but I will greatly appreciate it, if you answer before the trial period expires - which is in two days.
I am embarrassed to say I completely forgot to mention you can make our text extremely large if you prefer. Go to our top left menu and choose “settings” then “appearance”.
My mini viewer with a large font.
We also have many different theme options there with different contrasting text. Please try it.
1 Like
Got it, thank you for your assistance.
I will get back to DUMeter.
