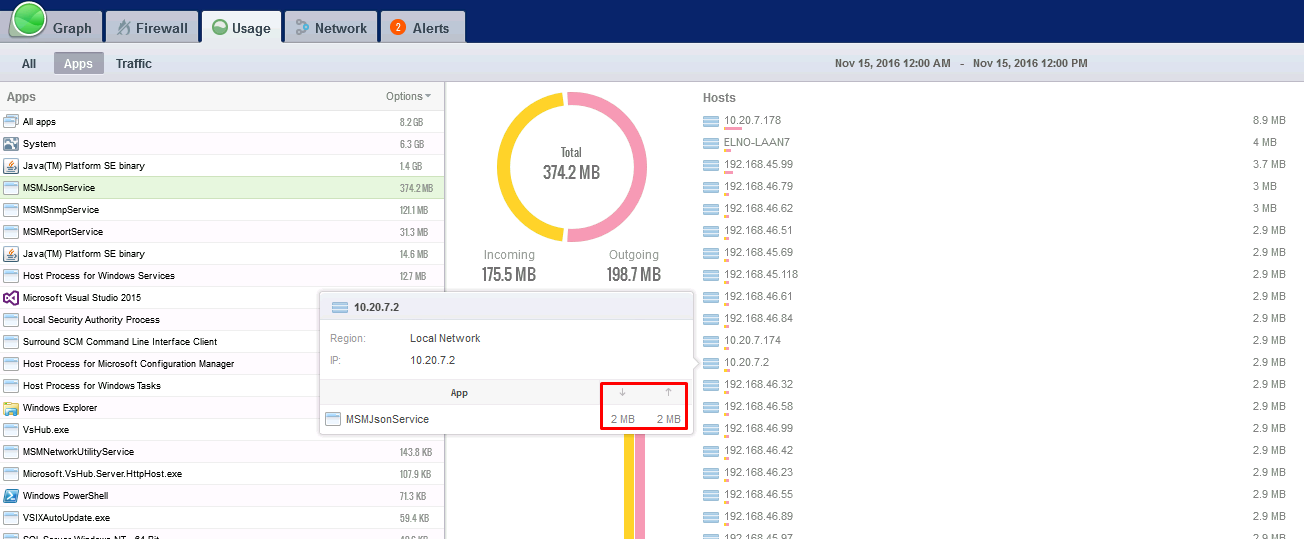
Is it possible to get a more detailed view of the bandwidth usage between a certain application and hosts? For instance, in our 24 hr measurement, it says a total of 2.9 MB with a certain host, but in the popup when I click this certain host, it says outgoing 2 MB and incoming 2 MB. Is it possible to make it not approximated, but more detailed? I believe this is really 1.45 MB outgoing and incoming, not 2 MBs.
If I were you I’d go to the GlassWire “Graph” tab, then click “apps” then play with the bottom sliders to find the point in time that this data happened. Next click the name of the app you want to see more data for, so you only see the data for that app on the graph.
You can then click the graph to see all that apps data over time, for example if you see a big spike you can click the graph at that point to see what hosts the app was communicating with at that time.
To understand the graph you can read this post https://blog.glasswire.com/2016/05/09/understanding-glasswires-graph-and-scaling-how-much-data-are-you-using-on-your-pc/.
I hope this helps!
Thanks for your reply, Ken.
This service I’m monitoring is running 24/7 on a server, and what I’m interested in is detailed information about the interaction between this service/application and a specific IP-address over time (total usage after 24 hrs). The only view I can find of this is an approximation to integers in MBs. I would like to see this in kBs instead, since the ammount is rather small.
You may have already noticed, but you can also go to Usage/Apps, and find the app, then break down the traffic that way. I thought maybe the graph would be more useful for the data you wanted to see.
Is it possible to do a conversion of MB to KB to figure out the number? Let me know and I can confirm the number for you in KB.
Thanks!