When "GlassWire Control Service" is running during a fast download the DPC AUDIO latency skyrockets and makes the PC nearly unusable to the point of the entire system including mouse cursor is freezing (incognito mode doesn't help)

Thanks for your detailed report @Remah. Our network is not as fast as yours, that’s cool!

I will say that we have many Fortune 500 companies using our software on their servers on fast networks and I don’t ever recall a report from an ISP or company who said we slow something related to the network.

We’ll see if we can recreate this on our end.

Meanwhile we’re in the final month or so of our backend rewrite that we have been working on for awhile. The update will use less resources and will allow us to move forward with our MacOS version hopefully before the year is out.

Unfortunately this still seems to be an issue with Glasswire 2.2, above 200-400Mbps it starts to stutter for me.

If making GlassWire’s monitoring asynchronous is not an option, some way to completely ignore an application, such as Steam for when I am downloading would be great. Using the GlassWire incognito mode doesn’t seem to help, only entirely stopping the service fixed the issue.

1 Like

We’re going to release an optional “lite” version of GlassWire that will be out for slower PCs. It doesn’t log hosts and it will be out in the next few months.

1 Like

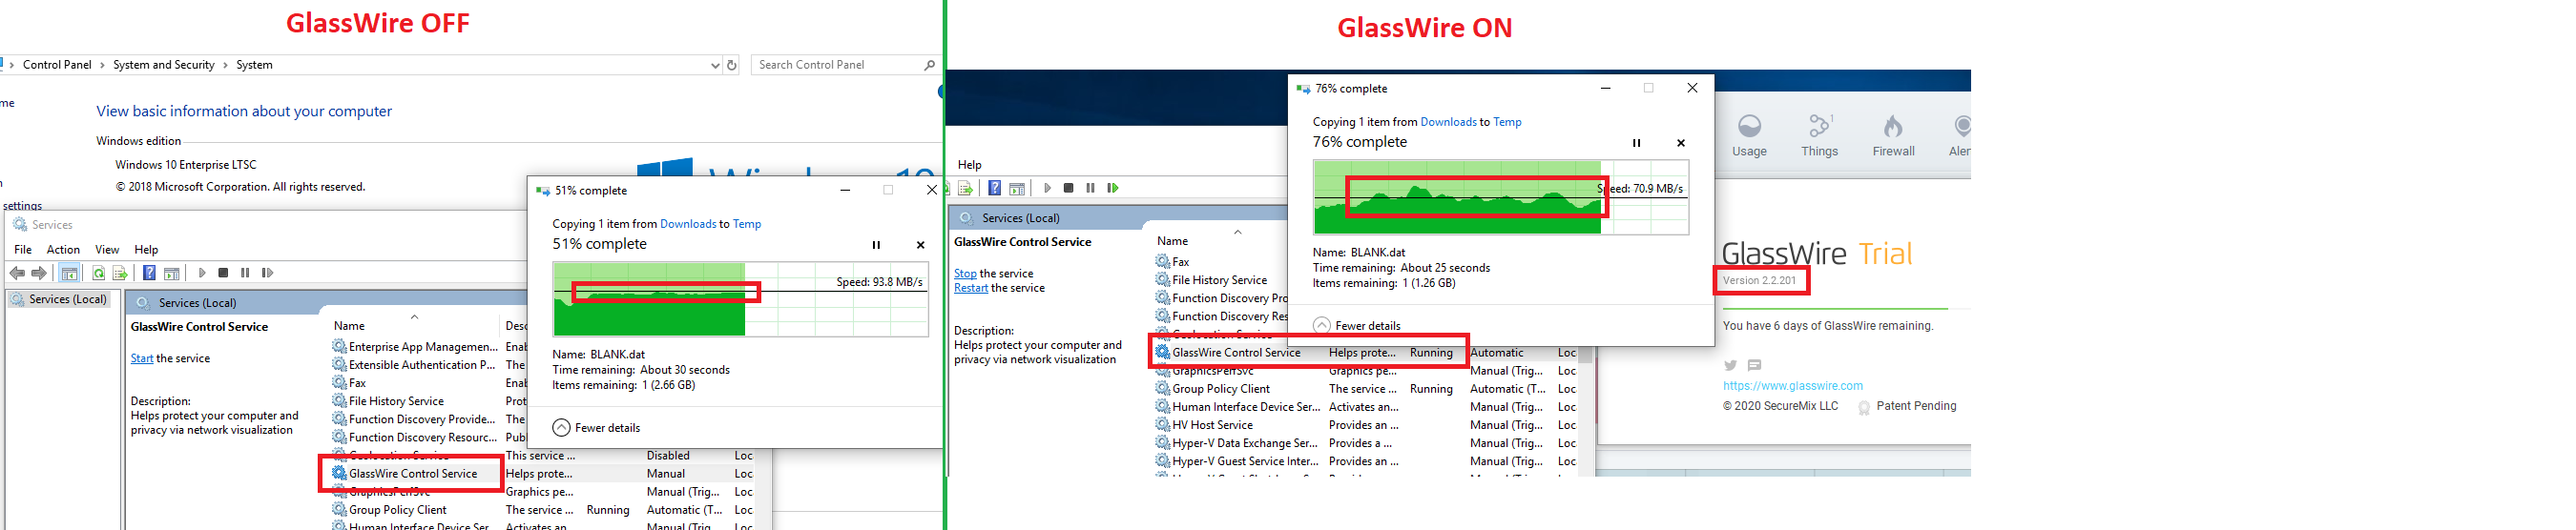
At those download speeds I get DPC issues but I don’t get audio stuttering because I use Process Lasso in Probalance mode and this maintains responsiveness. Running Latencymon clearly shows that my system has issues which would likely cause stuttering if I didn’t run a process optimizer.

Latencymon report

CONCLUSION


Your system appears to be having trouble handling real-time audio and other tasks. You are likely to experience buffer underruns appearing as drop outs, clicks or pops. One or more DPC routines that belong to a driver running in your system appear to be executing for too long. At least one detected problem appears to be network related. In case you are using a WLAN adapter, try disabling it to get better results. One problem may be related to power management, disable CPU throttling settings in Control Panel and BIOS setup. Check for BIOS updates.
LatencyMon has been analyzing your system for 0:16:05 (h:mm:ss) on all processors.


SYSTEM INFORMATION


Computer name: MA08
OS version: Windows 10 , 10.0, version 1903, build: 18362 (x64)
Hardware: Alienware 17, Alienware, 0MPYM4
CPU: GenuineIntel Intel(R) Core™ i7-4710MQ CPU @ 2.50GHz
Logical processors: 8
Processor groups: 1
RAM: 16265 MB total


CPU SPEED


Reported CPU speed: 2494 MHz

Note: reported execution times may be calculated based on a fixed reported CPU speed. Disable variable speed settings like Intel Speed Step and AMD Cool N Quiet in the BIOS setup for more accurate results.

WARNING: the CPU speed that was measured is only a fraction of the CPU speed reported. Your CPUs may be throttled back due to variable speed settings and thermal issues. It is suggested that you run a utility which reports your actual CPU frequency and temperature.


MEASURED INTERRUPT TO USER PROCESS LATENCIES


The interrupt to process latency reflects the measured interval that a usermode process needed to respond to a hardware request from the moment the interrupt service routine started execution. This includes the scheduling and execution of a DPC routine, the signaling of an event and the waking up of a usermode thread from an idle wait state in response to that event.

Highest measured interrupt to process latency (µs): 33134.50
Average measured interrupt to process latency (µs): 24.952987

Highest measured interrupt to DPC latency (µs): 33122.30
Average measured interrupt to DPC latency (µs): 14.024317


REPORTED ISRs


Interrupt service routines are routines installed by the OS and device drivers that execute in response to a hardware interrupt signal.

Highest ISR routine execution time (µs): 379.355253
Driver with highest ISR routine execution time: ndis.sys - Network Driver Interface Specification (NDIS), Microsoft Corporation

Highest reported total ISR routine time (%): 0.013757
Driver with highest ISR total time: ndis.sys - Network Driver Interface Specification (NDIS), Microsoft Corporation

Total time spent in ISRs (%) 0.02630

ISR count (execution time <250 µs): 255625
ISR count (execution time 250-500 µs): 0
ISR count (execution time 500-999 µs): 1
ISR count (execution time 1000-1999 µs): 0
ISR count (execution time 2000-3999 µs): 0
ISR count (execution time >=4000 µs): 0


REPORTED DPCs


DPC routines are part of the interrupt servicing dispatch mechanism and disable the possibility for a process to utilize the CPU while it is interrupted until the DPC has finished execution.

Highest DPC routine execution time (µs): 33138.747795
Driver with highest DPC routine execution time: ndis.sys - Network Driver Interface Specification (NDIS), Microsoft Corporation

Highest reported total DPC routine time (%): 0.117690
Driver with highest DPC total execution time: ndis.sys - Network Driver Interface Specification (NDIS), Microsoft Corporation

Total time spent in DPCs (%) 0.402451

DPC count (execution time <250 µs): 2184774
DPC count (execution time 250-500 µs): 0
DPC count (execution time 500-999 µs): 14430
DPC count (execution time 1000-1999 µs): 415
DPC count (execution time 2000-3999 µs): 12
DPC count (execution time >=4000 µs): 0


REPORTED HARD PAGEFAULTS


Hard pagefaults are events that get triggered by making use of virtual memory that is not resident in RAM but backed by a memory mapped file on disk. The process of resolving the hard pagefault requires reading in the memory from disk while the process is interrupted and blocked from execution.

NOTE: some processes were hit by hard pagefaults. If these were programs producing audio, they are likely to interrupt the audio stream resulting in dropouts, clicks and pops. Check the Processes tab to see which programs were hit.

Process with highest pagefault count: outlook.exe

Total number of hard pagefaults 9559
Hard pagefault count of hardest hit process: 2189
Number of processes hit: 83


PER CPU DATA


CPU 0 Interrupt cycle time (s): 86.892270
CPU 0 ISR highest execution time (µs): 199.724539
CPU 0 ISR total execution time (s): 1.745509
CPU 0 ISR count: 226063
CPU 0 DPC highest execution time (µs): 33138.747795
CPU 0 DPC total execution time (s): 27.985715
CPU 0 DPC count: 2007986


CPU 1 Interrupt cycle time (s): 30.560836
CPU 1 ISR highest execution time (µs): 379.355253
CPU 1 ISR total execution time (s): 0.240752
CPU 1 ISR count: 25320
CPU 1 DPC highest execution time (µs): 516.539695
CPU 1 DPC total execution time (s): 1.079728
CPU 1 DPC count: 38925


CPU 2 Interrupt cycle time (s): 31.782135
CPU 2 ISR highest execution time (µs): 90.211307
CPU 2 ISR total execution time (s): 0.043322
CPU 2 ISR count: 4171
CPU 2 DPC highest execution time (µs): 366.143945
CPU 2 DPC total execution time (s): 0.346120
CPU 2 DPC count: 28557


CPU 3 Interrupt cycle time (s): 27.106567
CPU 3 ISR highest execution time (µs): 44.371692
CPU 3 ISR total execution time (s): 0.000818
CPU 3 ISR count: 50
CPU 3 DPC highest execution time (µs): 186.843625
CPU 3 DPC total execution time (s): 0.174699
CPU 3 DPC count: 14799


CPU 4 Interrupt cycle time (s): 29.599547
CPU 4 ISR highest execution time (µs): 15.311949
CPU 4 ISR total execution time (s): 0.000217
CPU 4 ISR count: 22
CPU 4 DPC highest execution time (µs): 493.920209
CPU 4 DPC total execution time (s): 0.404097
CPU 4 DPC count: 30961


CPU 5 Interrupt cycle time (s): 30.071397
CPU 5 ISR highest execution time (µs): 0.0
CPU 5 ISR total execution time (s): 0.0
CPU 5 ISR count: 0
CPU 5 DPC highest execution time (µs): 798.451083
CPU 5 DPC total execution time (s): 0.342023
CPU 5 DPC count: 25920


CPU 6 Interrupt cycle time (s): 28.088837
CPU 6 ISR highest execution time (µs): 0.0
CPU 6 ISR total execution time (s): 0.0
CPU 6 ISR count: 0
CPU 6 DPC highest execution time (µs): 171.381315
CPU 6 DPC total execution time (s): 0.397360
CPU 6 DPC count: 28390


CPU 7 Interrupt cycle time (s): 26.082160
CPU 7 ISR highest execution time (µs): 0.0
CPU 7 ISR total execution time (s): 0.0
CPU 7 ISR count: 0
CPU 7 DPC highest execution time (µs): 794.942662
CPU 7 DPC total execution time (s): 0.343011
CPU 7 DPC count: 24100


1 Like

Do you use any special settings? I installed ProcessLasso and with the default settings it doesn’t seem to do much, it detects that system responsiveness is absolutely terrible but it doesn’t seem to actually fix it.

AFAIK, the only change I have made is for one process. I exported the configuration to find the specific change:
DefaultPriorities=firefox.exe,above normal

I can think of several reasons for the difference in our experiencve. The most likely are:

  • The network driver runs on one CPU core so the difference might be due to your computer running the process on a less capable core.
  • You might be testing with more hosts than me which will increase GlassWire’s load.
  • As above, I’ve increased the priority for Firefox which is running the speed test and playing a video.

From a quick and dirty test, I think that giving Firefox a higher priority may be the main difference. It largely stops my problems with audio artefacts during video playback. Without Process Lasso I always get popping, but no stuttering. With Process Lasso I largely eliminate popping. I could get better performance by using a more rigid rule but I like Probalance because I don’t want to setup more than one rule.

Hello there,

I’m currently evaluating GlassWire 2.2.201 and I notice network “slowdowns” at fast speeds. For my testing below, I am running Windows 10 1809 + 1Gbps Ethernet. I will be copying a file from 1 PC on the network to another PC on the network via ethernet.

GlassWire OFF (this will serve as our baseline)
Transfer speed range around 90-100 MB/s.

GlassWire ON (test subject)
Transfer speed will jump up/down between 65-90 MB/s

The transfer speed with GlassWire OFF seems more stable while GlassWire ON seems to jump.

@Will

Thanks for your report.

We will try to reproduce this. GlassWire just uses an API for network monitoring from Windows that should not impact network performance in any way.

Is your firewall set to “on” or off? Which mode? Do you have anything blocked with the firewall at all? Are you a paid or free user?

Also, it looks like you are moving files locally on your HD, not over the network? Or am I mistaken on that? If it’s another PC, does that PC have GlassWire also or not?

I just tried on my own PC and could not reproduce this but I’ll ask our QA to do so. Also it looks like you are using two different file sizes. I tested using the same file.

Hi @Ken_GlassWire,

  1. My firewall is ON, but I don’t have anything BLOCKED.

  2. I am a free user evaluating the product in TRIAL MODE.

  3. I am moving file from local PC [GlassWire INSTALLED] to another PC [GlassWire NOT INSTALLED] on the network, so data is being transferred via 1Gbps ethernet.

1 Like

Thanks! We will investigate and try to reproduce this.

I was unable to reproduce any speed degradation issues on my own PC in my own local network environment.

We also had our QA test for speed degradation issues in a protected environment under strict rules to make sure the results could not be compromised.

QA TESTING RESULTS - The results showed no slowdown.
We used the exact same file and environment every time during testing. We also tested some other ways just out of curiosity and we had similar results like below.

GlassWire is running on both PCs (remote and local).

GlassWire is running on the receiving PC and stopped on the local PC.

GlassWire is not running on either PC.

We were unable to make GlassWire degrade network activity with our testing.

But why wouldn’t GlassWire degrade network activity?
It’s not magic how GlassWire gathers network activity. We use a Windows API to do so, and pretty much every application that monitors network activity uses this same API. If that built-in Windows API degraded the network when used, then that would mean pretty much every antivirus, network monitor, or network related apps would also degrade the network.

Since the API we use is part of Windows itself there isn’t much we could do about it even if we found it did actually cause some kind of network slowdown. I guess we could open a bug report with Microsoft about it?

It’s also theoretically possible that some old versions of Windows could perhaps have a bug with that API. If you are experiencing a degradation please try updating Windows with Windows Update.

Could GlassWire cause degradation another way?
Of course GlassWire is not perfect. It’s possible there could be some scenarios or unexpected things that could cause anomalies and some sort of network slowdown. Please consider checking what apps GlassWire is blocking with its firewall. Perhaps the firewall is somehow blocking an app that is needed for Windows to work properly. For example maybe your ISP requires a special app for your network to function fully.

We’ll keep investigating for possible scenarios where this slow down could occur and we appreciate your detailed report.

We also have this Blog post on different testing methods we have used in the past to test GlassWire’s network monitoring accuracy if anyone has any questions on proper ways to test.
https://blog.glasswire.com/2016/06/15/glasswire-network-monitoring-accuracy/

I think if you’re going to test you should at least be sure the network stays the same (no random devices downloading in the background), and I think you should use the exact same file with every test. It’s also important that no other applications are actively running on Windows (on either PC) that could cause issues.

For example Windows Update or a game may decide to randomly started downloading in the middle of your test, making it completely inaccurate.

Anyone who has used GlassWire knows how random apps can begin using major data for any reason at any time in the middle of your test. I think that’s one reason people enjoy using our software. GlassWire makes it easy to see what’s using your bandwidth all the time.

Also, this thread was originally posted about the use of an app called “Latencymon” to test with GlassWire. It’s an app that checks for AUDIO latency and it’s not related to the network at all unless I am mistaken? This is a completely different issue and it’s unrelated to this test.

I think people are finding this thread about audio latency and they are misunderstanding and thinking this thread is about network issues and now this thread has become off-topic, but I wanted to follow up here due to the recent posts mentioning network tests along with GlassWire.

I just updated the thread subject to include the word “Audio”.

I can’t reconcile the reported issues with your latest response. There appears to be a number of misunderstandings.

The audio issues reflect the CPU-bound network drivers competing with audio drivers for CPU priority. Windows is unable to sustain pseudo real-time operation due to interrupt queues getting too long.

You are probably correct to add the word “audio” to the topic title but it shouldn’t be “DPC audio” because the DPC issue relates to all interrupts not just audio interrupts. Too many DPCs also affects network driver interrupts as well which is the point you are missing.

I wouldn’t expect any slowdown testing with examples at 10-12 MBps. That is well below the range where we notice issues which is at a minimum of 200 Mbps or 20 MBps.

GlassWire’s requires CPU time over and above the Windows processes that provide the API - becomes more significant at higher transfer rates. This overhead is significant. We’re finding it impacts multiple different systems at about at 20MBps.

Here’s one of my examples with a 22% drop in throughput due to running GlassWire at more than half a gigabit (0.5Gbps or 500Mbps is about 50MBps):

I expect some drop in throughput but it is clearly a major concern for some other users who find that the drop in network throughput is accompanied by a drop in the quality of their audio playback.

@Remah

Thanks for these details.

We are planning a “GlassWire Lite” optional version that will be out soon. If you don’t want to keep track of as many hosts, this update will not do so and it will use significantly less resources.

GlassWire has to work to keep up with hosts and track network activity so it will use some resources to do that. I guess it’s a trade-off if you feel it’s important to keep track of network activity or not, and if you need a firewall or not.

GlassWire Lite will be a great alternative for those who like to keep the use of their resources super light and well optimized. If you’re a Basic, Pro, or Elite user you can choose to use GlassWire Lite if you prefer. There is no need to pay for another license to use it.

Free users can use GlassWire Lite also with the same free/paid feature set as our normal GlassWire software. We look forward to releasing GlassWire Lite and announcing it in the forum so you can give it a try.

1 Like

@Remah Can you please test it also with turned off BFE service (i.e. turned off WFP)?

Also see https://kc.mcafee.com/corporate/index?page=content&id=KB89750&locale=en_US

200-400 Mbps is slow? Lol! I wish mine would go that fast! 187.5 Mbps :sweat_smile:

Hey guys, I just wanted to say I also had this issue, and I could find a mostly reliable way to reproduce the issue we all have.
I have done so with the following steps:

  1. Run glasswire in the background (ensure the driver etc. is also on)
    2a) Start up an online minecraft game. It is of importance there is at least a dozen amount of players in your vicinity.
    2b) Open at least 2+ YouTube windows, where one is a playlist for music and another is just a video on your second monitor.

Within an hour, you should have a total system freeze and CPU spike belonging to System Interrupt (see process hacker, all CPU core graphs show that same spike). Opening LatencyMon, it will either show dxgkernel, and/or your gpu driver .sys file, ignore those.
Then somewhere you will see tcpip.sys
Creating a Windows Performance File and analyzing it will also show the high DCP count from tcpip.sys during the time the PC froze.

Honestly, I have literally been debugging this for a total of 2 of my free days, all gone now to this. :frowning:
After looking up about this I initially thought it was a hardware problem, as system interrupts were described by forums to be a hardware problem. Maybe there is in issue with how your program interacts with the LAN driver? I am not experienced in driver programming, wouldn’t know.
Alas I finally fixed my problem, after neither bios updating, complete driver update or full windows clean install helped.

1 Like