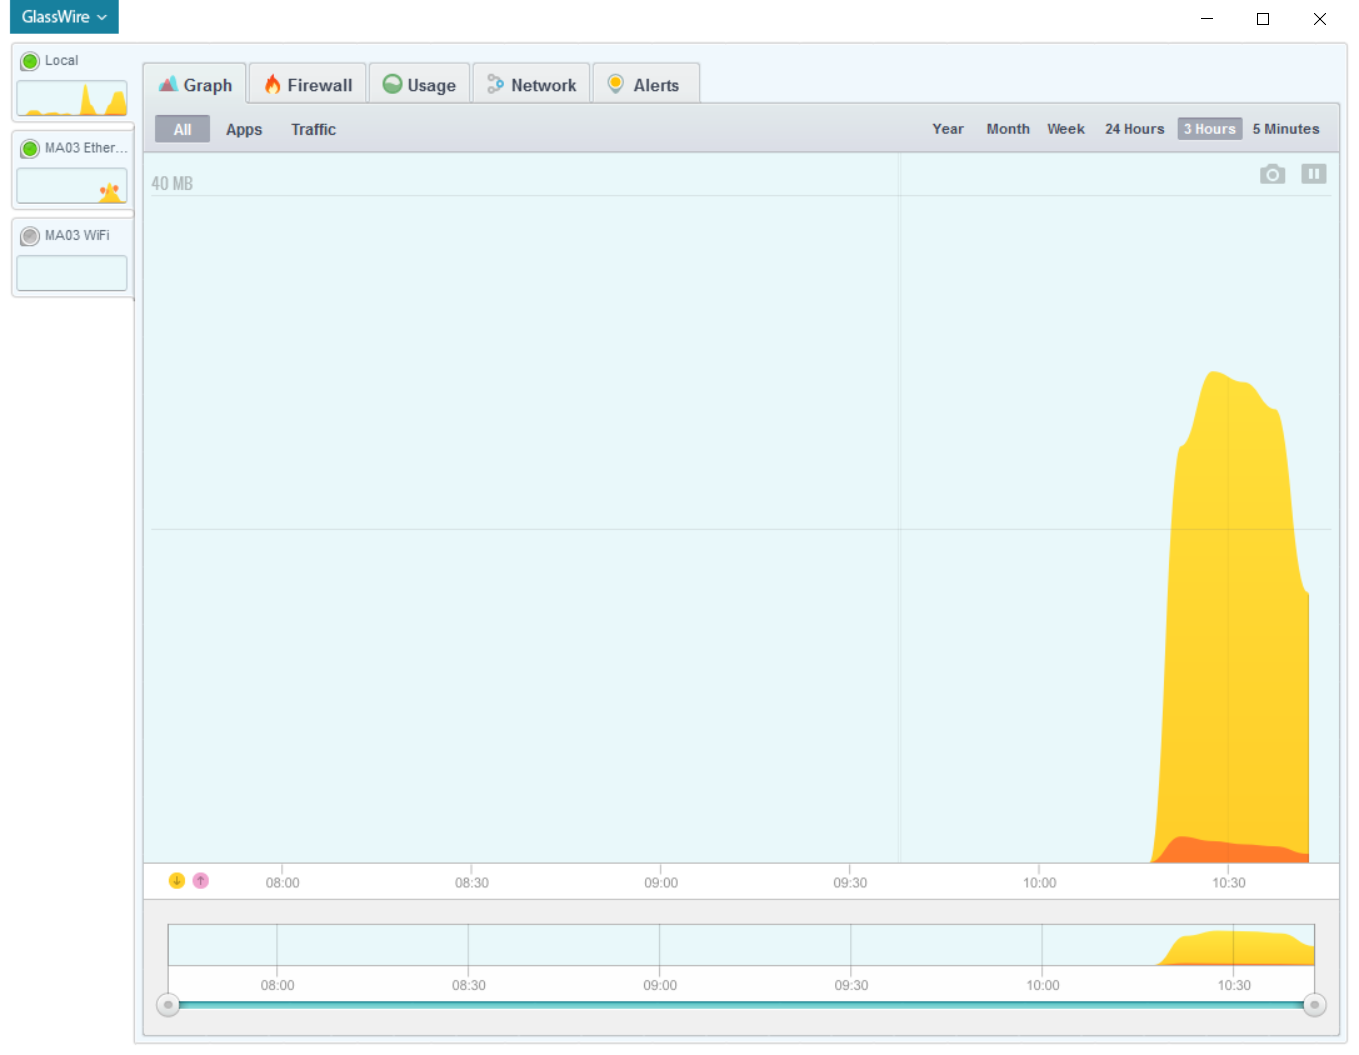
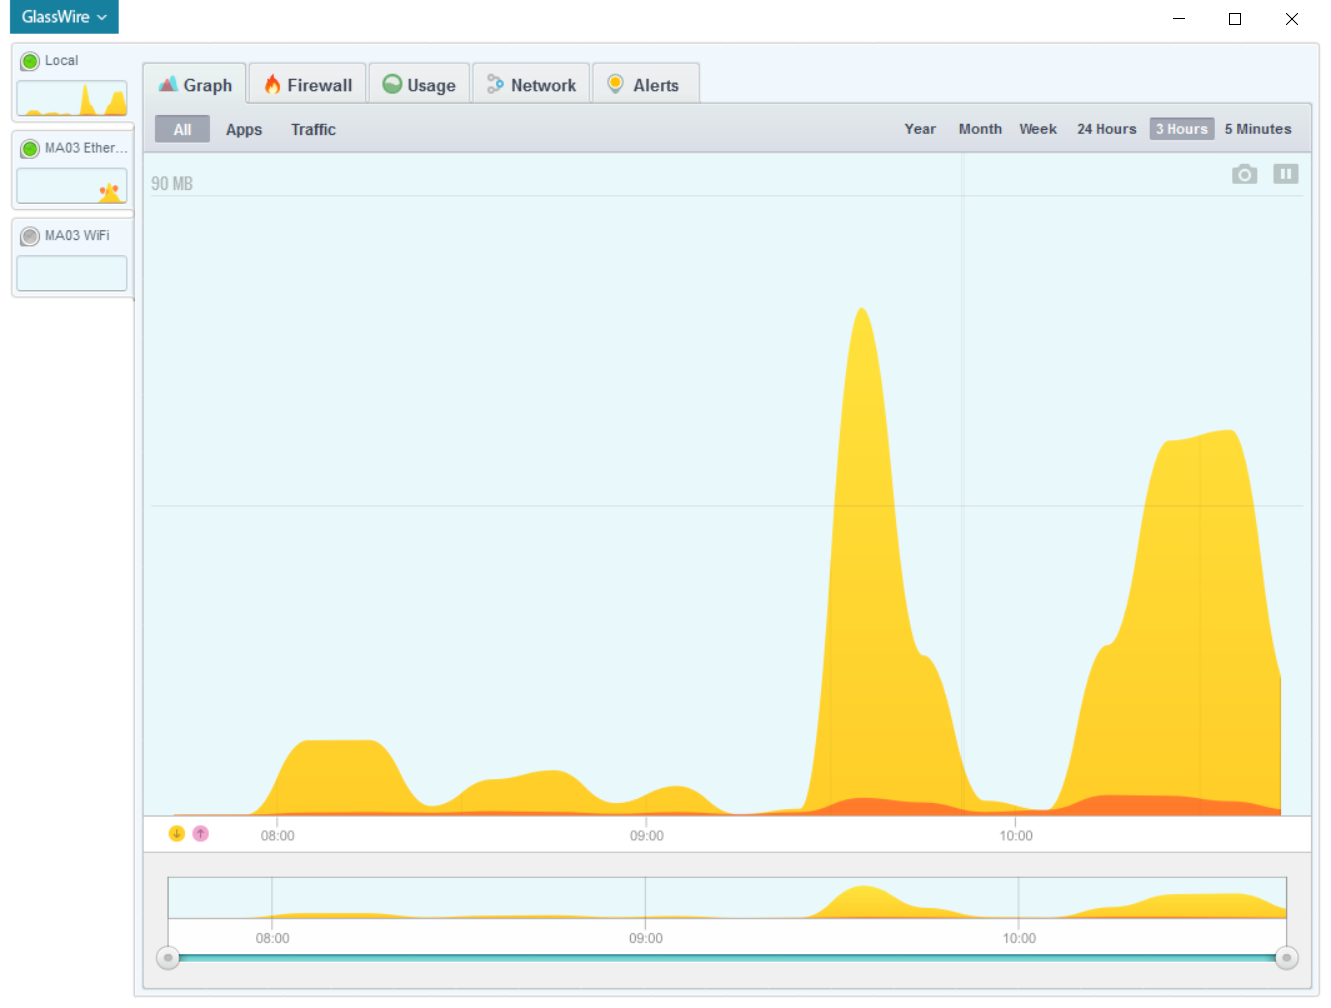
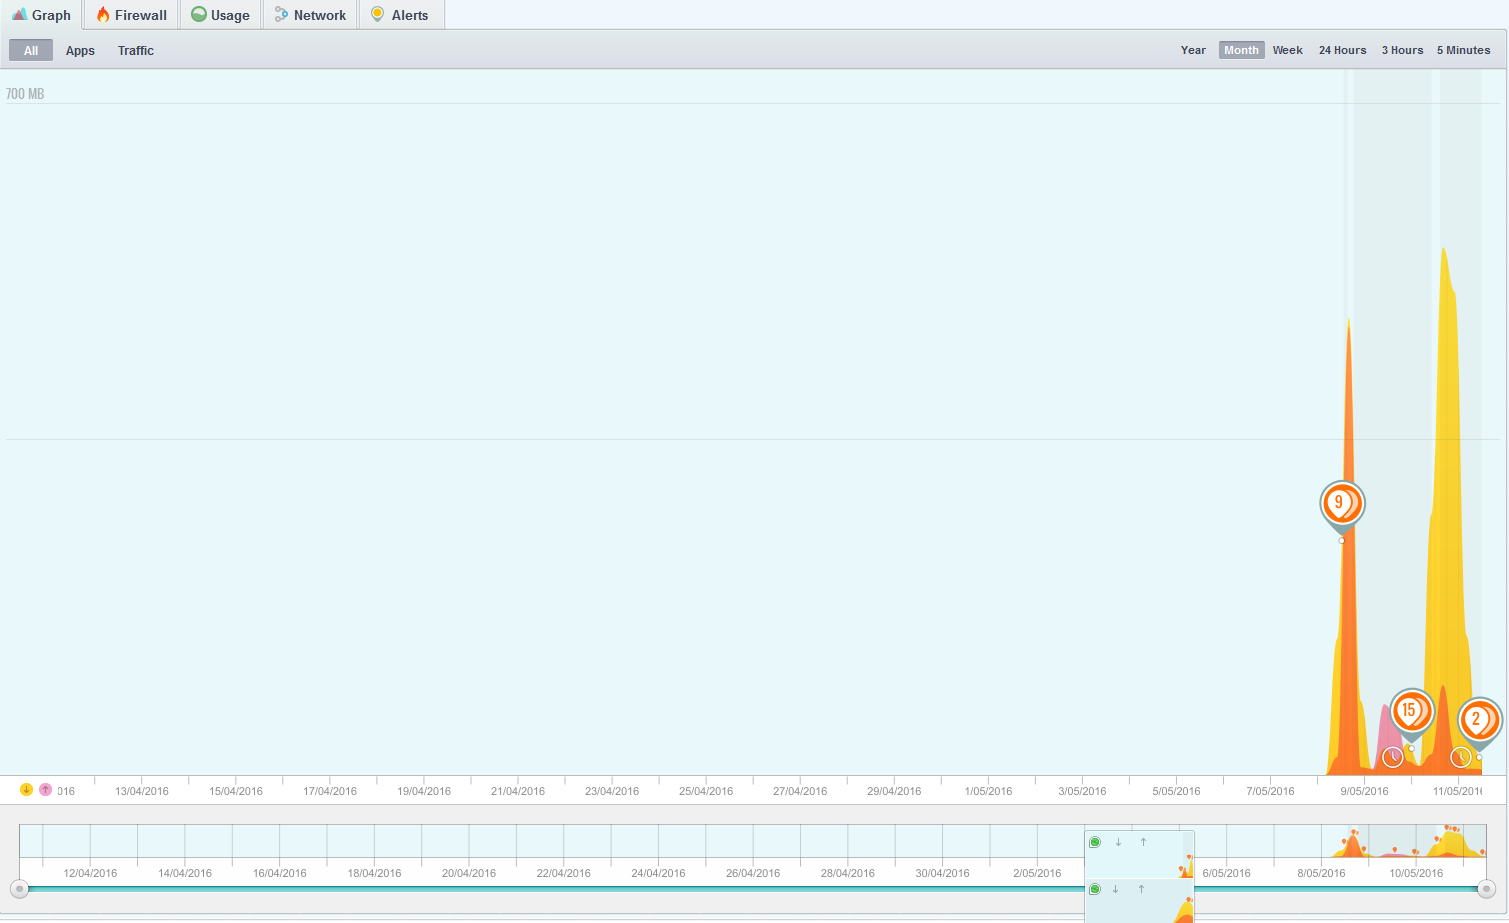
Here’s one view with the only difference being the window width are slightly different. (I edited this post to remove the pixel sizes because they were incorrect as I had copied them from the wrong place)
It is confusing is that the wider graph shows a lot more detail. As expected the wider graph can show more detail but even so the difference is too dramatic.
More detail is shown even though the graph limit has increased from 40MB to 90MB. It is normal to have the opposite
What also confuses me is that the height of the peak at 10:30 increases from about 30MB to about 60MB.
Thanks for your report. I didn’t reply yet because we were testing ourselves. Last night we were unable to recreate this problem on our own so maybe the public version we released this morning fixed it.
I suspect that the issue has been there a long time but it is an unusual occurrence and therefore difficult to reproduce.
It is probably very unusual
The difference in scaling for the initial screenshots was the ratio 90MB:40MB which is ~2.2 times. I haven’t been able to reproduce scaling that different using the default slider settings while changing the window size. The highest ratio I could get was 2 times. For the 3 Hours view I could only get 1.6 times. This suggests that the problem I found is unusual.
It is most likely to occur in the graphs for a day or less
In general, the greatest differences in scaling occur when resizing the windows for the Graphs for 5 Minutes, 3 Hours and 24 Hours. So it is probably unlikely to occur on the other graphs.
Here’s the approximate differences I could produce today in the different graphs:
1.0x 5 Minutes (defaults the sliders to 1 minute)
1.6x 3 Hours
2.0x 24 Hours
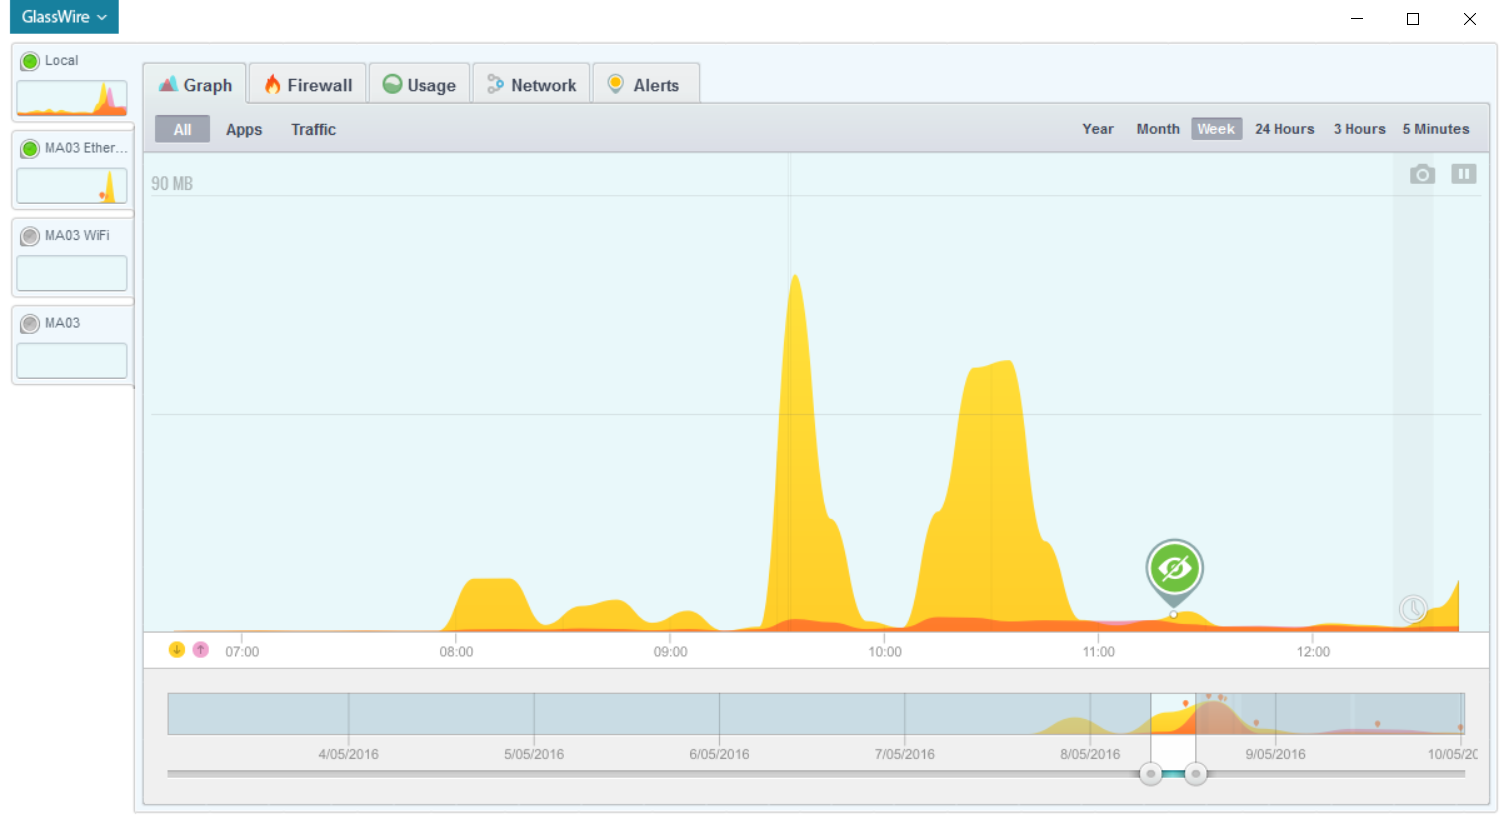
1.1x Week
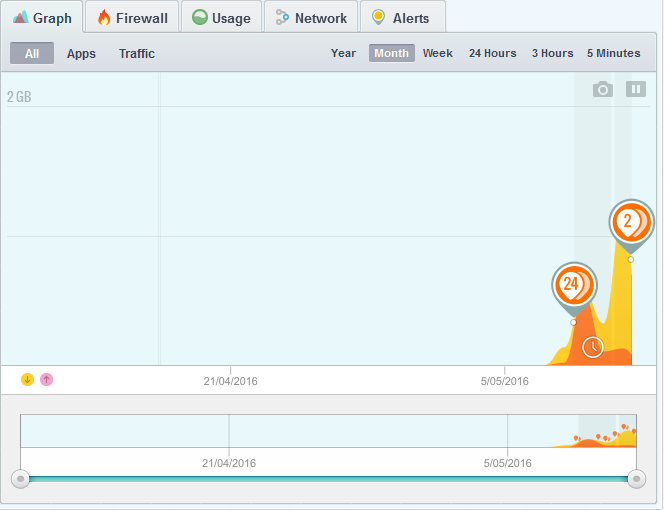
1.3x Month
1.0x Year
It may be more likely to arise using the sliders
If I use the sliders I can produce much greater differences in scaling from resizing the GlassWire window. So if I make the 5 Minutes graph show the full 5 minutes then I get a bigger difference.
1.5x 5 Minutes
The biggest difference I found was more than 5 times (60MB:11MB) by looking at less than one hour of the 3 Hours graph.
Thank you for your report. There could be a misunderstanding here.
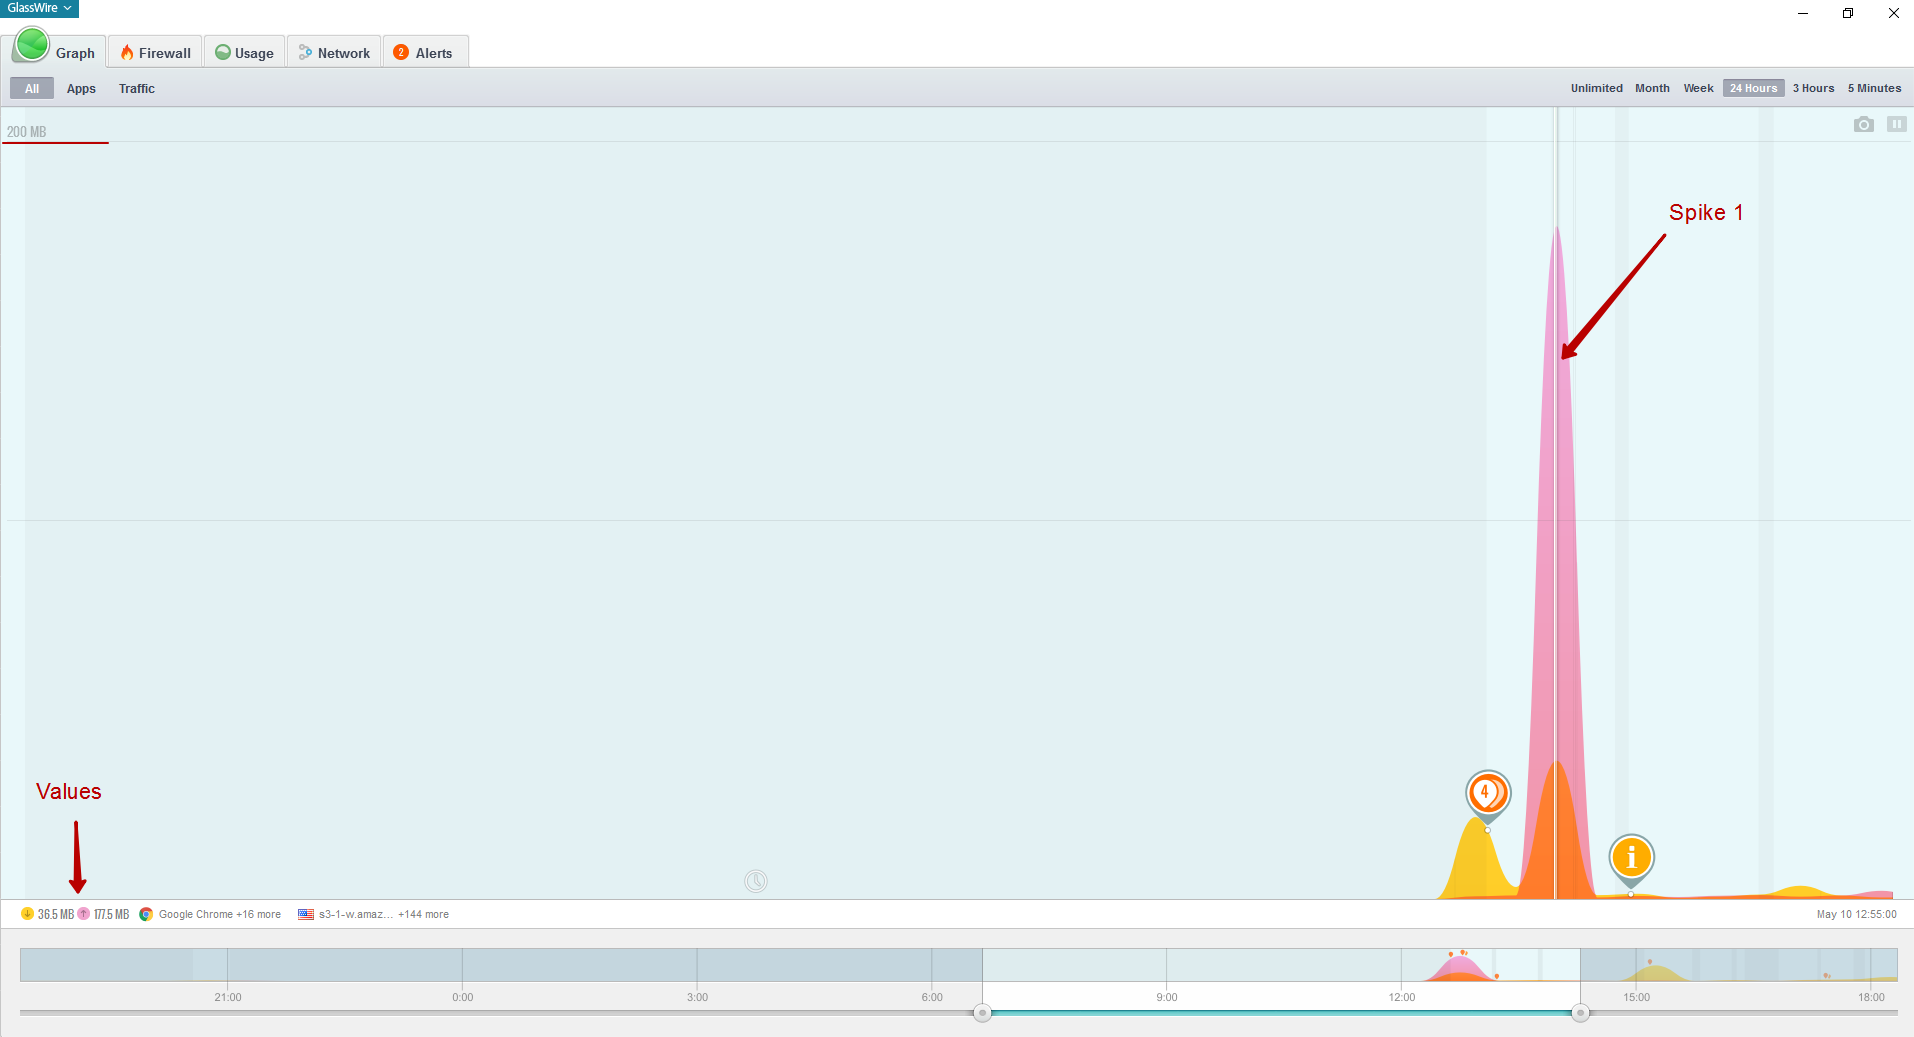
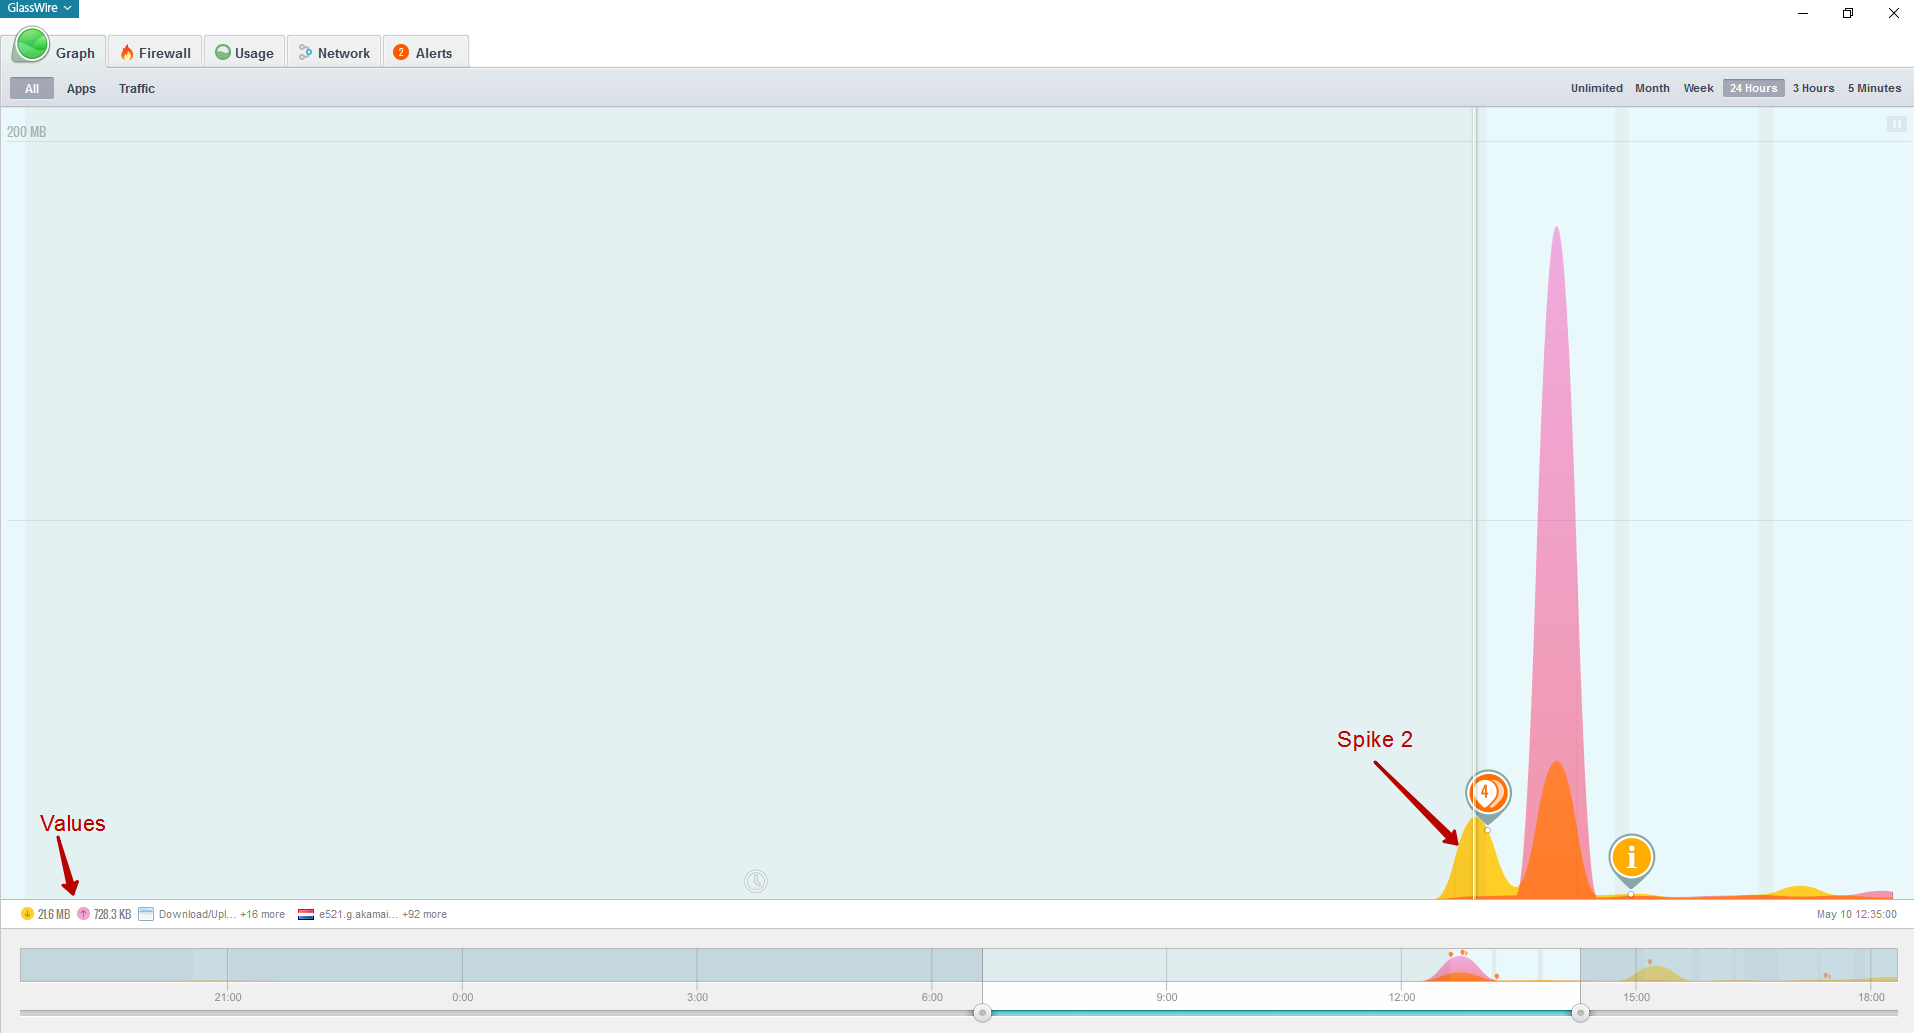
When a GlassWire user changes the window size, the graph scale also changes. We can see some spikes if the window is small, but if the size is increased those spikes may be divided into several lower spikes. And vice-versa, for example, GlassWire is running in full screen mode and we can see several spikes and then when we decrease the size of the window, those spikes will be combined into one big spike.
The amount of traffic will be also recalculated so the top left value will change.
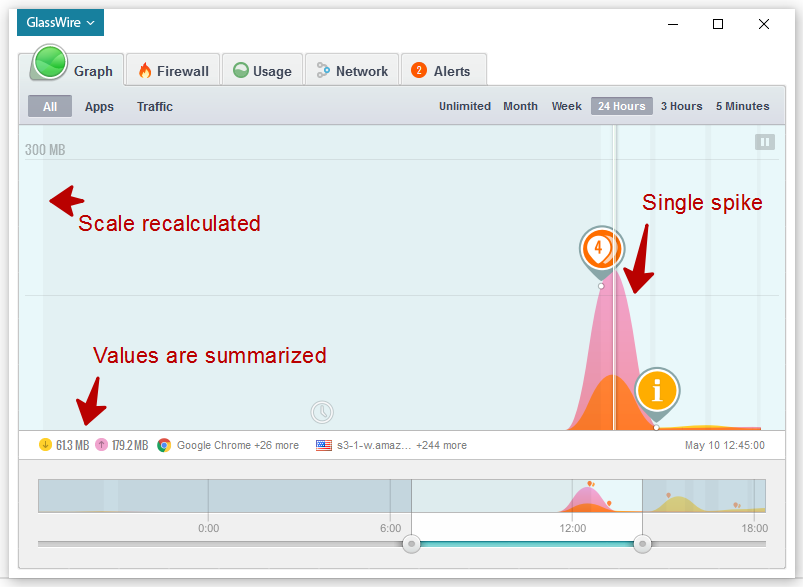
For example, we have two spikes in 10MB and 20MB and the top right value is 30MB. Then we’ve decreased the window size so those two spikes are combined into a single spike.
Since two spikes were 10 and 20 MB, that single spike will be about 30MB. So the top right value will be recalculated too, and this is required to fit the graph in the graph area and the new top right value may be 50-60MB.
Thanks, that’s how I thought it was working. This means that the higher my screen resolution then the greater the differences in the scaling. That also means that using FullHD (1920x1080) I am more likely to get the problem I reported in this post. A screen at HD (1366x768 or similar), which is the most common resolution at the moment, will be much less likely to have that issue.
These examples are a good primer for new users, too.