As a very interested observer - I’ve posted a lot on related topics in this forum - I would like to see the complete GlassWire window because the settings in the missing pane are crucial to identifying if this is problem with GlassWire.
A small change to the span of the graph view will affect the throughput shown in the main graph. While you might be in the 5 minute view, you might have inadvertantly changed the sample period thereby producing the discrepancy. I think that this might be the cause of the discrepancy because any change in that view span will increase the data throughput rate shown in GlassWire which is exactly what you are seeing. It is not possible to reduce the view span to less than a minute so the opposite cannot occur.
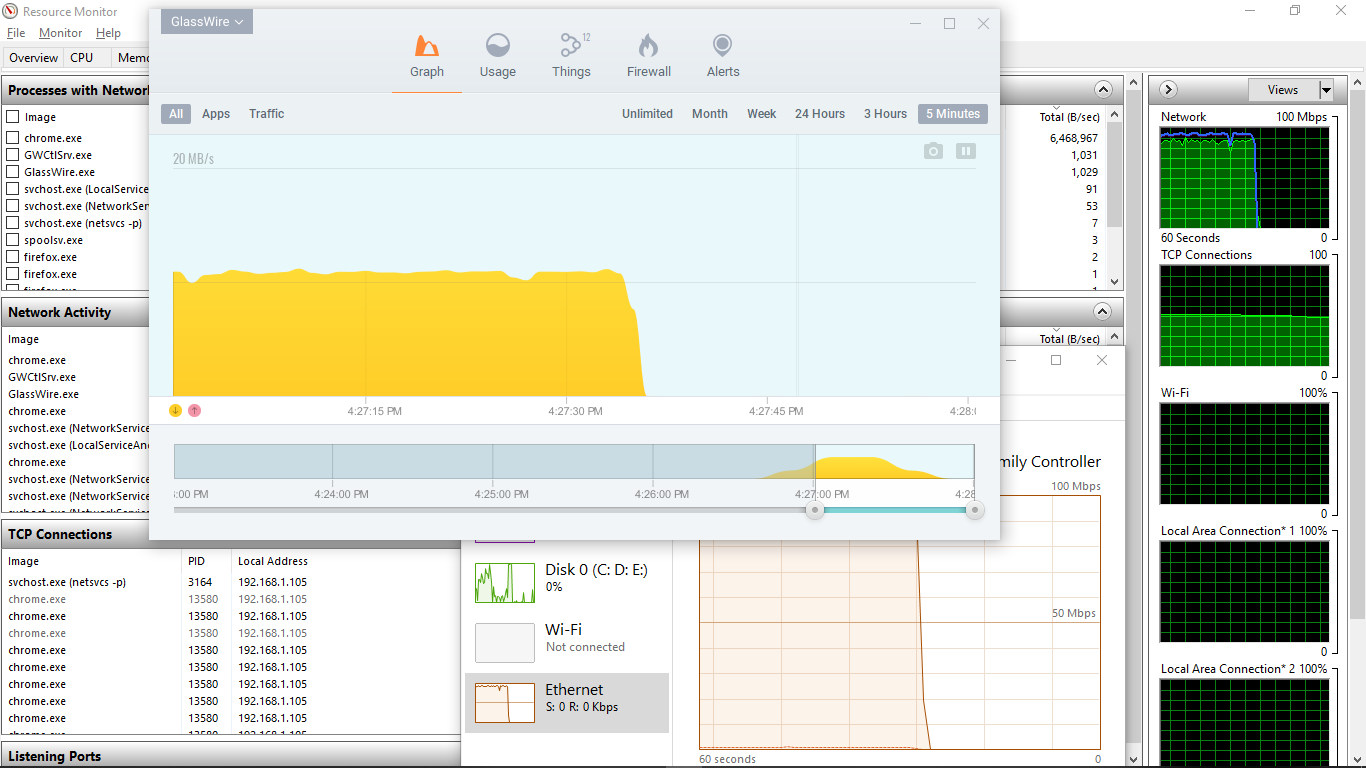
You can see the two GlassWire graphs in this example of my own. The smaller bottom graph indicates the default one minute view of the five minute graph:
P.S. I should have added that I tried reproducing the problem myself but wasn’t able to. I used GlassWire to stop everything except Google Chrome (and needed host processes), downloaded a known file size and checked the results comparing GlassWire with Task Manager and Resource monitor as shown in the above example. I couldn’t reproduce a discrepancy in several attempts with downloads from local and overseas websites. I also confirmed that the total downloaded data recorded by GlassWire matched what was expected.