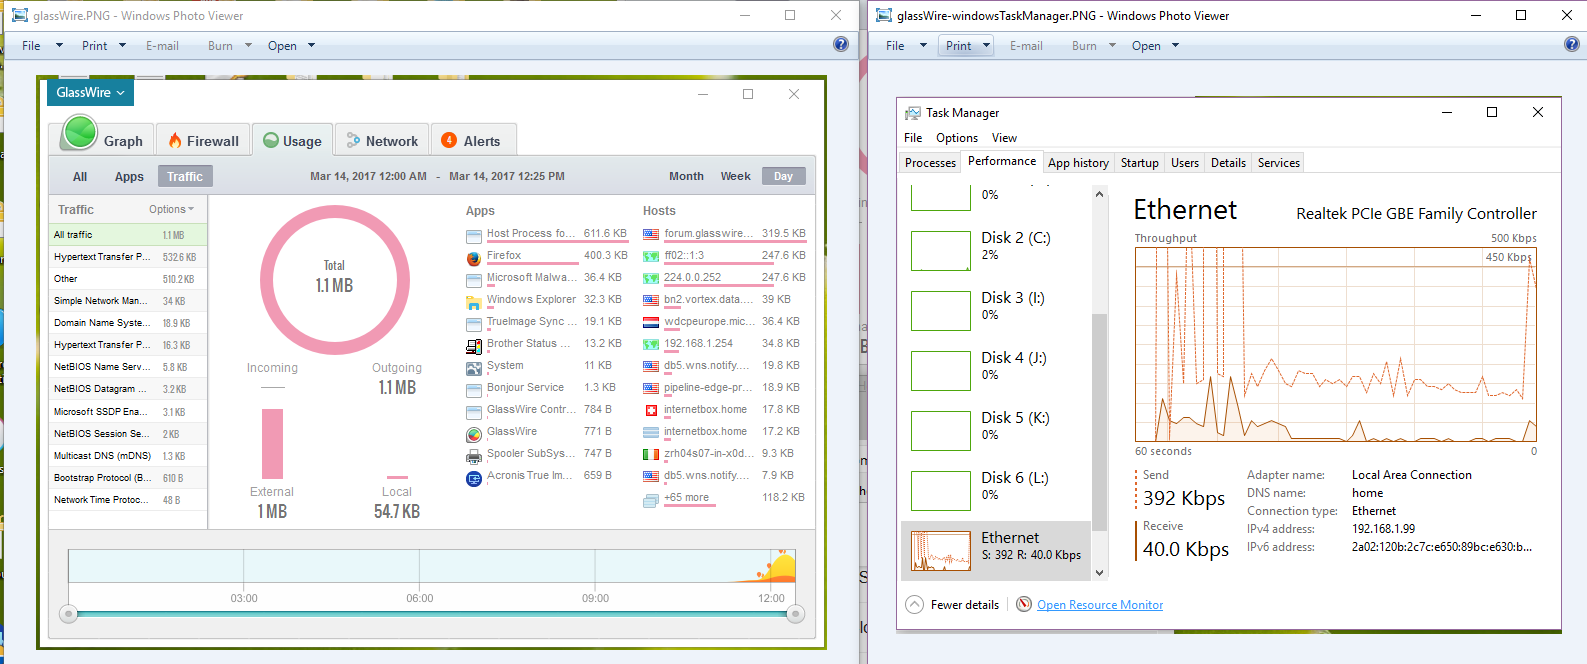
There appears to be a large discrepancy between the Glasswire usage monitor and the Windows10 Task Manager Ethernet Monitor which I cannot understand.
In the picture, Glasswire shows a total usage of 1.1MB over a 25 Minute period.
The Ethernet Monitor appears to show an average rate of 150Kbits/s (say 20KBytes/s) over the same period, which would be about 25MBytes total for that period. The picture shows a 60 second window, but its been approximately the same over the entire 25 minute period.
If this were a car then you would be showing the speedometer and the odometer. It makes it very difficult for the GlassWire staff to answer your question. I’m looking at your screenshots, and there is nothing in them that shows any discrepancy.
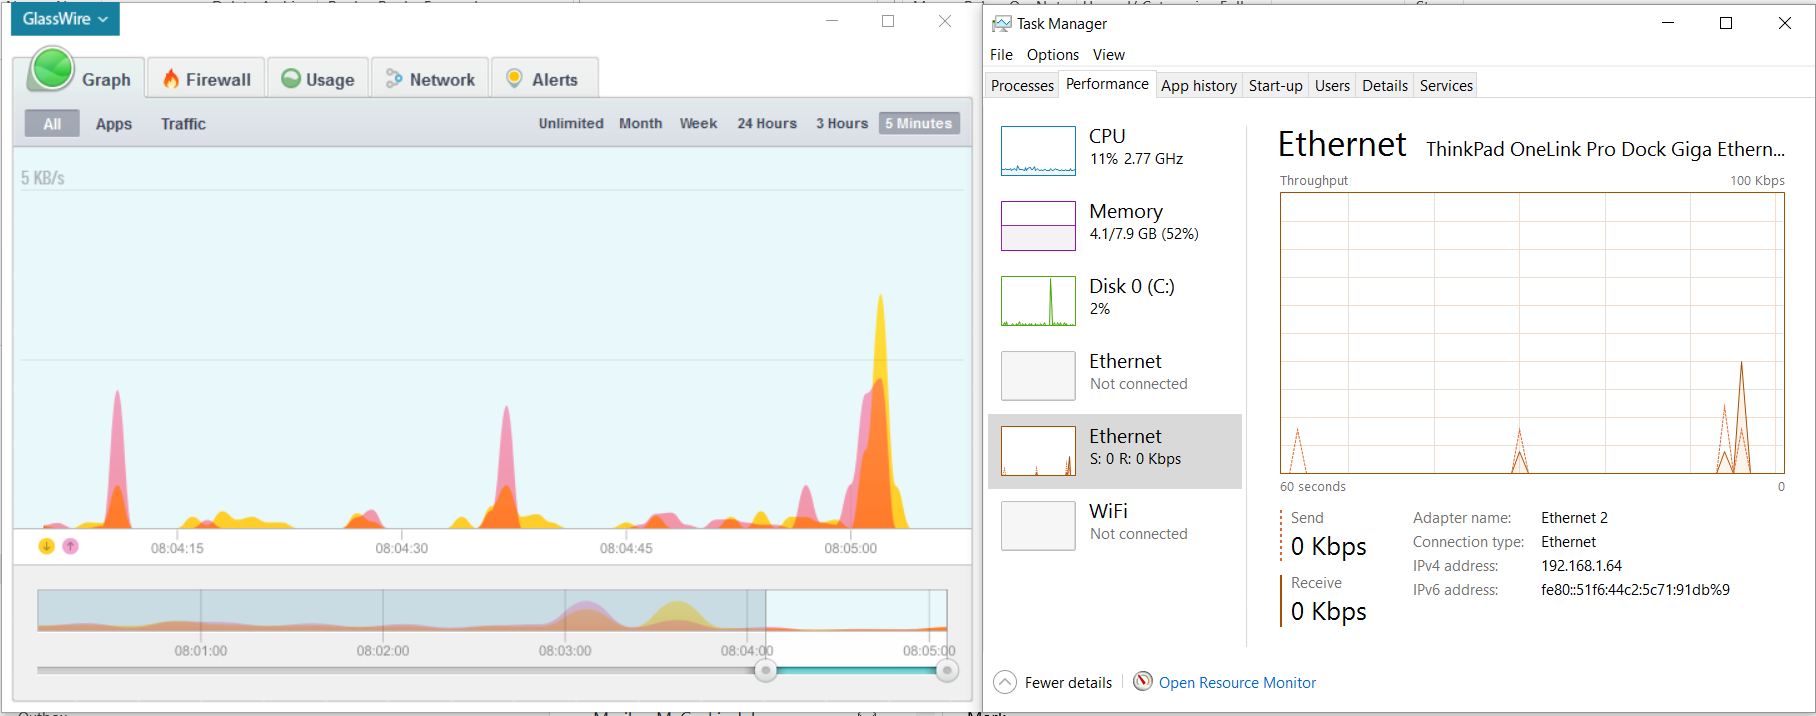
You should show something that is reproducible so GlassWire staff (and even other users like me) can see there is a problem. You could, for example, show the GlassWire Graph for the same 60 second period. You could do this by displaying the 5 minute view and use the sliders on the bottom graph to reduce the view to one minute. But even if you do that there are a lot of issues as should be visible in my example:
The graph styles are very different so the results only approximate each other
Task Manager is rounding traffic flows so it shows no traffic during periods where it is very low.
GlassWire autoscales so it is very difficult to get the graph scales to match.
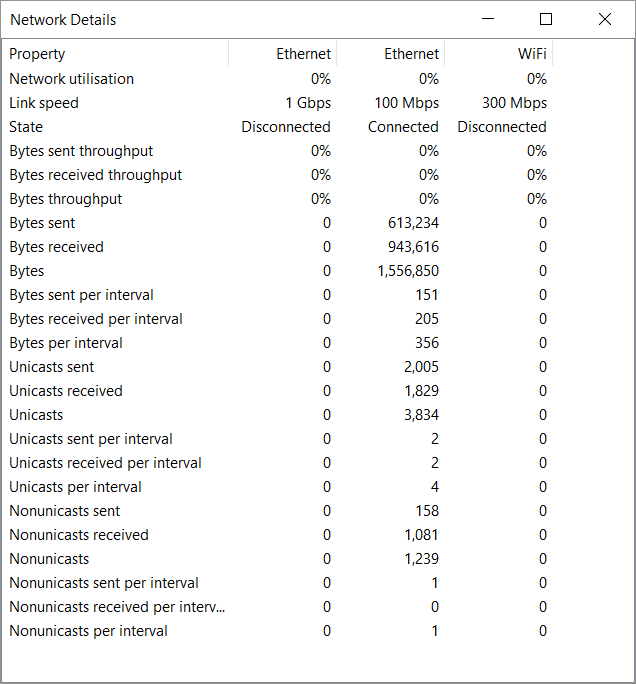
What you should do instead is right-click on the Task Manager network view and select View network details because this will show you accumulated bandwidth which you can compare with GlassWire’s Usage view: