Hi -
Searched, but didn’t find find a complete answer.
I’m a new user and, while I like GlassWire for many reasons, I don’t seem to have a great deal of control over the graphing functions. I would like, at a minimum, to have control of the vertical scaling and the ability of adding and controlling grid lines. Have I missed something, or at these controls not exposed?
Thanks,
Mike
@Mike_EE
GlassWire automatically scales. People have requested the ability to change the scaling and it was moved up to a higher priority on our todo list.
Thanks for your feedback.
1 Like
Hi Ken -
Thanks for the answer to the scaling question. What of the grid lines? I see that the GUI is built with Qt and I know this is practical using its built-in capabilities.
Thanks,
Mike
@Mike_EE
Please explain more about how adding grid lines would be useful. Perhaps what you need will be implemented with the scaling option we’re working on.
A grid line must be in a specific place on the graph to be functional. How could it work to let you move the grid lines around? If the grid line was even one pixel off then the graph would be wrong.
I am thinking I just don’t understand what you are asking.
@Ken_GlassWire
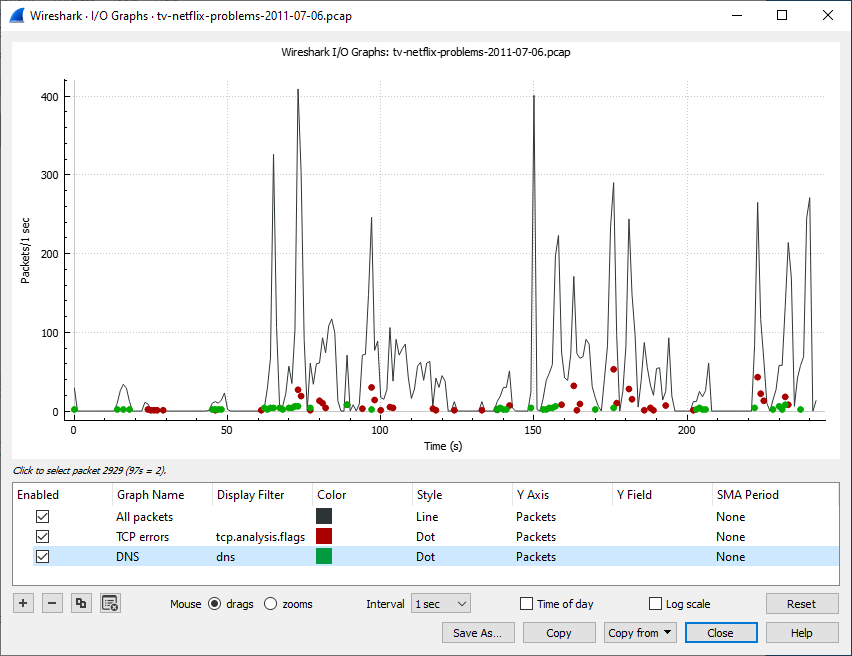
It’s axiomatic in visual data communication that grid lines help organize graphs in a rational, easy-to-absorb manner. Grid lines facilitate understanding-by-inspection and help you compare key thresholds. Without them, your mind has to draw an imaginary line to make comparisons.
Here is an example of an interface using grid lines to enhance readability:
I write this as someone that has written or project-managed electrical engineering programs with graphing capabilities and graphing features were always a matter of concern. I can, if you need additional convincing, provide references to papers on this topic.
Also, I think this can be implemented through the QVauleAxis class, which I was going to link to but apparently I don’t have the requisite permissions.
Thanks,
Mike
2 Likes
I see what you are saying now, thank you for these details! I will share this with our team.
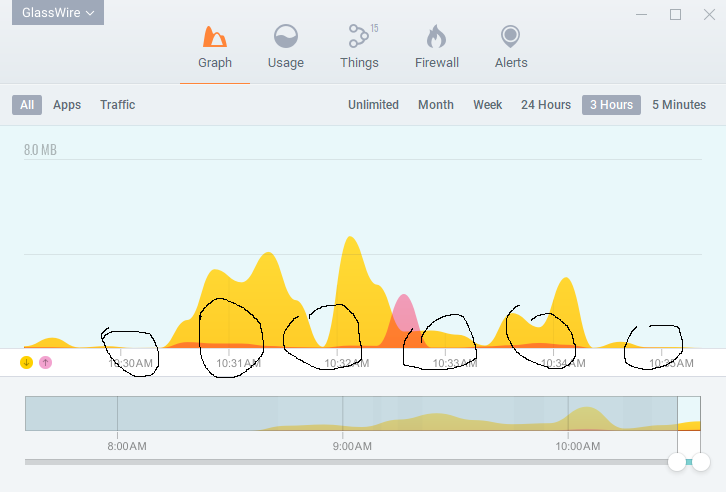
FYI, GlassWire does have vertical lines when the graph is present. The lines are just partial though, and I understand what you are requesting is a far more noticeable implementation.
Also, if you mouse over the graph a vertical line appears wherever you want. Then you can click the graph and it gives details on the network activity at that exact time period. It also pauses the graph.
@Ken_GlassWire
Thanks for the cursor tip.
Regards,
Mike
1 Like