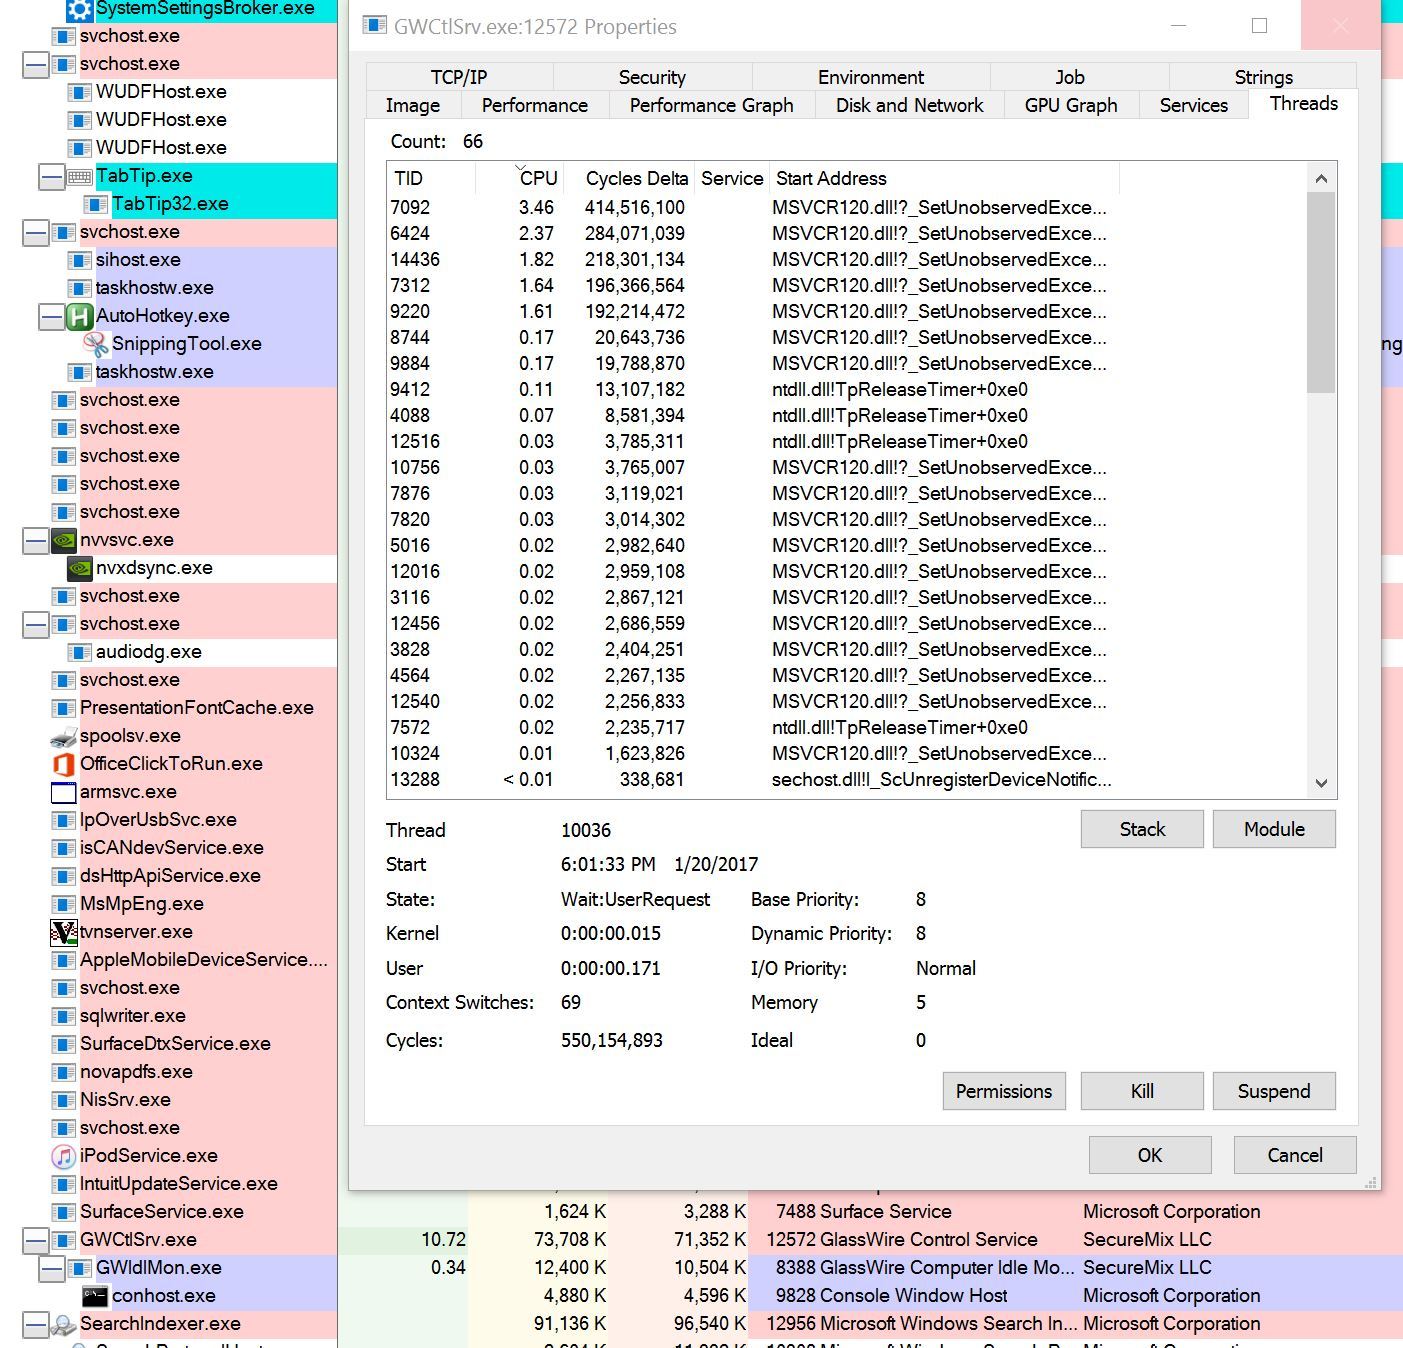
Saw a strange failure this afternoon. I could feel my Surface Book was getting hot, and saw something hogging 10 to 30% of my CPU. Resource Monitor pointed to GWCtlSrv, and Process Explorer showed this:
It kept creating more and more of the “MSVCR120? SetUnobservedExce…” threads. I couldn’t find any other clues there. Closing the GlassWire app did not stop this, it seemed to make it worse. Stopping the service did stop the CPU hogging, and restarting the service did not bring it back.
I thought the problem was handled, but then the whole computer locked up solid - no response to any controls, clock and status indicators not updating, Ctrl+Alt+Del ignored. Had to kill power to recover. No idea if that was related to GlassWire - the only thing in the logs at that point is Windows Defender deleting history and changing status. I was obviously using Process Explorer and Snipping Tool, but I do that a lot with no problem. It seemed the crash was a continuation of the GlassWire problem.
I doubt it will happen again, but wanted to report it in case it might connect with other reports. BTW, this is 1.2.88.
MSVCR120 appears to be a Microsoft runtime library and I don’t think it’s related to GlassWire. I searched around Google and couldn’t find any about this file doing this so I’m not sure what to suggest.
Could you try disabling network auto-scanning and switch to our manual scan and see if it helps with your resource usage?
To disable Network auto-scanning completely create a text file called glasswire.conf and place it in the c:\programdata\glasswire\service folder. Add this string to the text file: enable_network_scan = false then restart the GlassWire service. We plan to add a setting for this in the future.
@Ken_GlassWire, this looks like it does relate to GlassWire. And it does look like it is using a lot of CPU: 3.48 is more than I’ve seen for one thread in GlassWire.
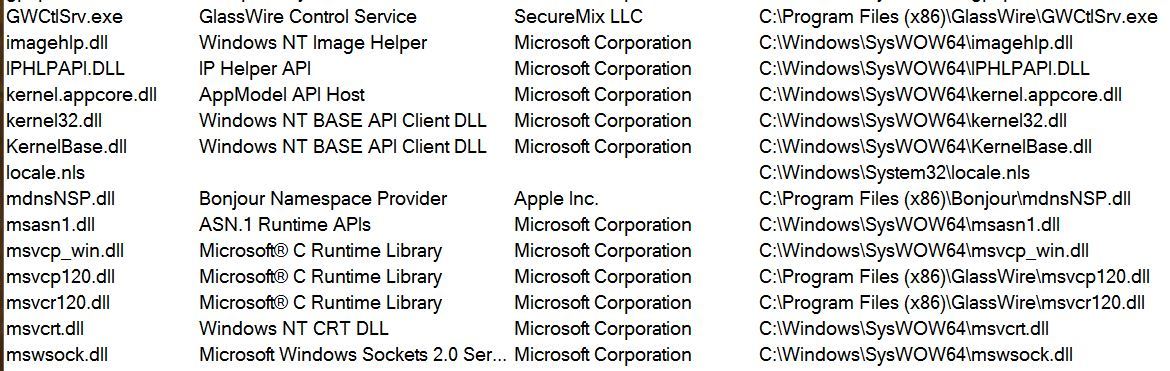
MSVCR120.dll is the Microsoft Visual Studio 2013 C Runtime. It is a DLL used by GWCtlSrv.exe as confirmed by running SysInternal ListDLLs. It is not a DLL included with Windows by default so it has to be installed. Do you use Microsoft Visual Studio for software development?
My understanding is that SetUnobservedException is to trap (or observe) an unobserved exception error that would otherwise crash the application. I wasn’t able to confirm the same behaviour on my install because I haven’t yet installed the Windows Debugging support used to display the thread information correctly. This code is likely to be standard for all of us but is it possible that this is from one of your special debug versions of GlassWire?
Listdlls v3.2 - Listdlls
Copyright (C) 1997-2016 Mark Russinovich
Sysinternals
BTW - Is there some trick to dragging images in here without deleting all the text?
When the Thread view first opened, it was all “GWCtlSrv.exe”. There was a lot of flashing and then all the MSVCR lines appeared. They stay on the same thread numbers, rack up cycles, then let them go. Some of them are from this morning’s wake from hibernation, others from yesterday’s reboot. Both are occasionally active. Rarely some other single thread appears and closes. These all stay in the list.
The scary part is that when I first opened Process Explorer, it was showing less than 1% CPU. Over about an hour it has crept up to about 8% CPU. Usually three or four of the MSVCR threads at around 2% - but different ones every few seconds.
I just saw the post about Network auto-scanning - will go try that next.
Restarted the service. CPU usage dropped from >9 to <3, with the four or five currently active threads using under 1% each. But still 62 threads, lots of MSVCR threads in the same activity pattern.
In the app, I only have the free version. The Network tab has a “Scan” button, and clicking it immediately killed about a dozen of the MSVCR threads - but opened a lot more. There are now 386 threads there! But the worst one is only using 0.1% CPU, and the total usage dropped to about 0.3%. Process Explorer uses about 20% CPU to show that Thread dialog - close it and usage drops under 1%!
The Scan button in the app is still pulsing the three dots… Oh - it just stopped, reported 5 devices, went back to Scan. Threads went back to 72, usage is already up to 8% again. Definitely a connection…
One some networks we open up multiple threads to make the scanning happen much faster, so perhaps this is using your resources. In this case changing the “scan” to manual only should solve the problem.
Meanwhile we’re working on an update that improves this plus we’re making it easy to make the scan optional in settings.
Ken, I did create the manual scan file before that last restart and scan button test. CPU usage was low while it was scanning, despite the 386 threads. But when the scan finished, it began creeping up again. Is there some way to check whether the file was effective?
I can’t imagine what changed to make this begin happening - last Windows update session was the 19th, GW 1.2.88 installed on the 20th, but my machine only started getting hot yesterday/30th. Maybe some covert Microsoft update, I see lots of things sneaking in despite the WU service being disabled.
Our team recommended to move the GlassWire database and restart the service:
The files that should be moved: C:\ProgramData\GlassWire\service\glasswire.db (-shm, -wal) and C:\ProgramData\GlassWire\service\stats folder completely. The service should be stopped before moving. We’ll keep on monitoring this issue and try to fix if we’ll find something.
Or, you could do a clean install of GlassWire with the “clean” install option instead. Please let us know if this solves your problem.
I hid the db files and re-enabled the service. It has replaced the files, but it is still showing the same threads in Process Explorer. And CPU usage is already creeping up - within half an hour PE says it is using 3% CPU. My Performance Monitor tray icons show at least that much usage, but strangely Microsoft’s Resource Monitor never shows more than 1%. Somehow it often ignores CPU hogs…
I checked the stack for one of the persistently active threads (they rack up lots of cycles, then drop back down the list while others hit the top, but the same thread numbers persist for minutes at a time, and will be back on top soon):
Ken, I only have the free version. I assume that means the webcam/mic is totally off. I certainly can’t set it one way or the other. But I just noticed another possible clue…
I was watching Process Explorer and Resource Monitor while I opened the GlassWire app to check that setting. When the app opens, the GWCtlSrv usage drops from about 3% CPU to 1% in Process Explorer, and it drops to zero in Resource Monitor! Each of the service threads drops from peaking at 0.5 to 1% to staying under 0.1% all the time. Close the app and they all jump back up…
At least they are staying under 1% each today. In that first screenshot during the hot screen problem, individual threads were using over 3%, and racking up 10X the number of cycles they are showing today.
What could having the app open change about the load on the service?
Having the app open should increase the CPU, not decrease it. Thanks for including the info about the webcam/mic alert being turned off. I’ll ask our team and see if they have some other ideas.
Just noticed my screen warm again. Not as bad as the first time, but way more than normal. Usually the usage by GWIdlMon is much lower than GWCtlSrv, but today it is higher than before. It calls the same MSVCR routine in a similar pattern:
We have similar hardware and we haven’t been able to reproduce the problem yet. I apologize for not following up sooner. There is a GlassWire update that was released this morning. Please try it and let me know your results.
Just tried the update. No change. With the app open on the screen, GlassWire uses about 2% CPU. With the app closed to the system tray, nearly 3X that. Quit the app completely, and it drops to maybe 2X, but obviously more than with the app open. Seems very strange.
I will update the team. Thank you for the detailed report. I have never heard of the GlassWire CPU usage going up when our user interface is closed, it’s so strange.
Our Surface uses maybe 1-2% CPU maximum every time and we can’t make our Surface have this problem. Can you scan your Surface for viruses with Windows Defender or a third party antivirus after that antivirus is up to date?
Installed the latest Defender and other updates yesterday, scan found no problems.
Just tried GlassWire all fresh - went immediately to ~3% of my i7 Surface Book for the GWCtlSrv process, with usually three MSVCR threads using 0.4% to over 1% each, and maybe twenty more using less. Open the GlassWire app and total drops near 1%, with four MSVCR threads between 0.1% and 0.3% and the rest <0.01%.