I have trouble reading what the meaning of the y-axis is. Here is an example:
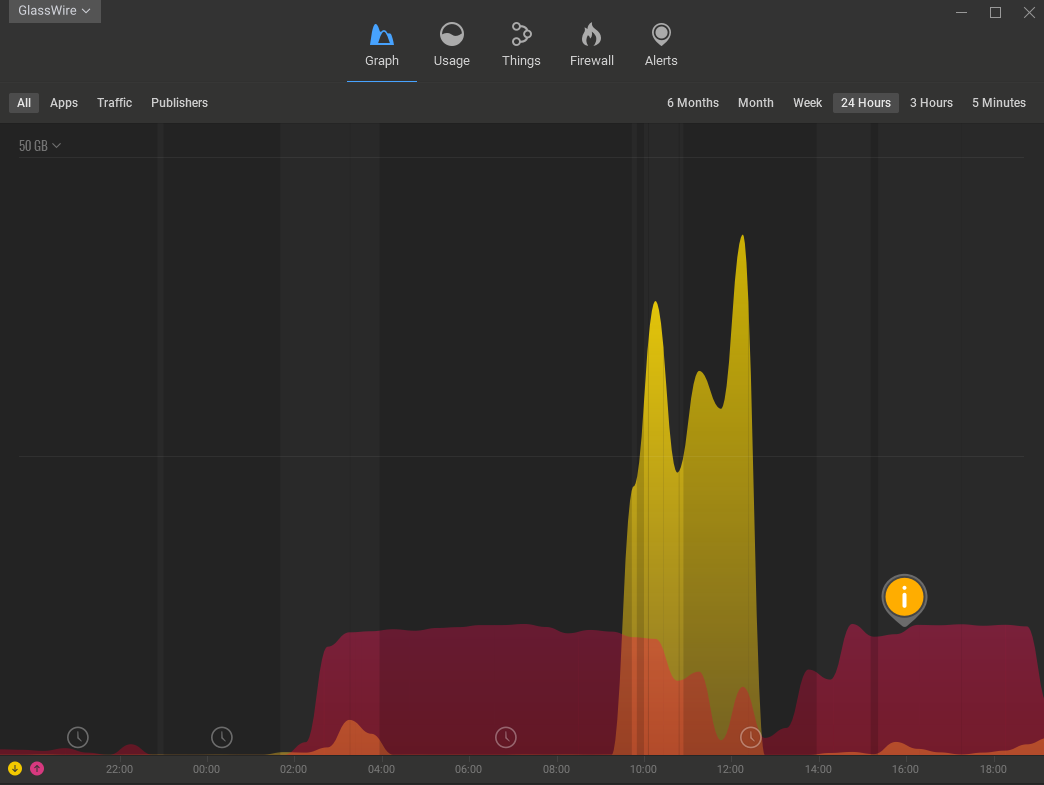
The horizontal axis is clearly labeled, but what am I supposed to see with the graph’s height? The auto-scaling has determined that something is “50 GB,” but I am not sure what this means.
Instead, could we have an indicator on the left about how much network bandwidth was used?