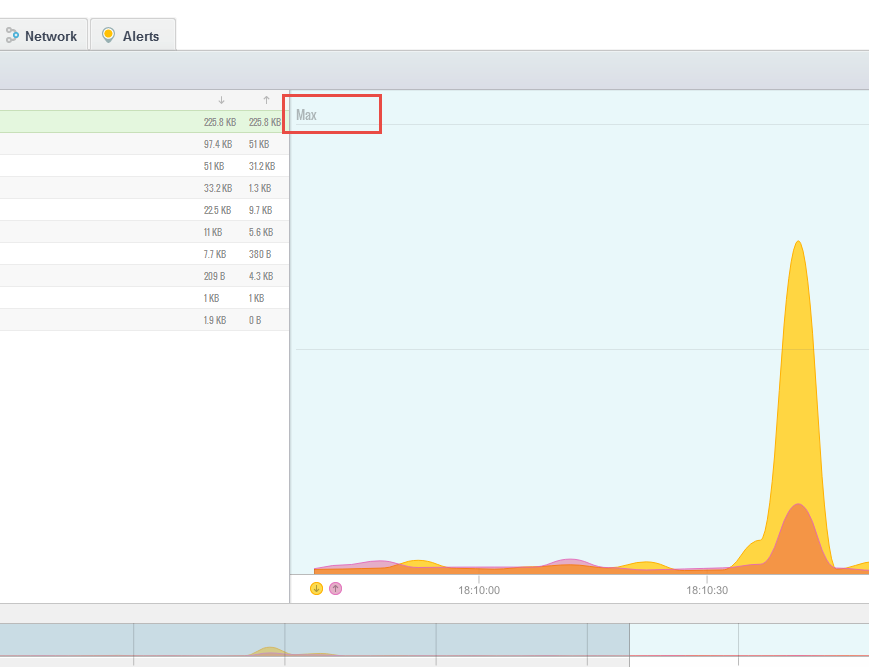
I recently updated from the public release of Glasswire 1.1.41b to 1.1.47b and the network maximum traffic display is now just displaying the word “Max”. Before it was showing me actual maximum values of the network in/out.
To reproduce:
Windows 10 x64 Pro
Install 1.1.47b on 1.1.41 - select to uninstall previous etc.
Reboot (Either or, results remain the same)
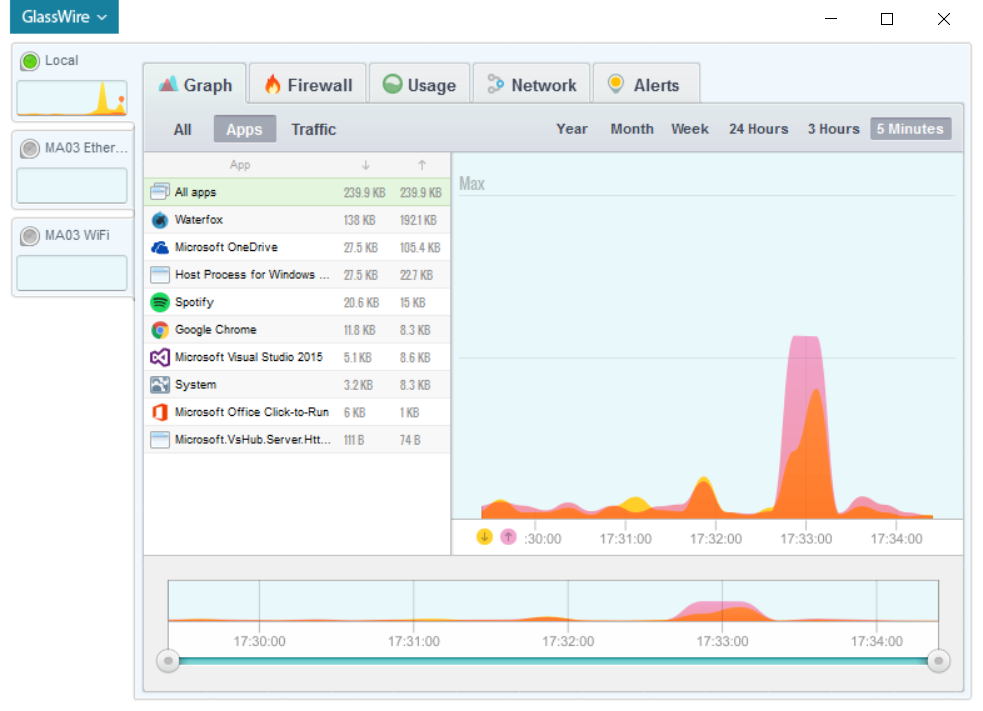
Fairly straight forward. I have included a screen for reference. I will additionally try a clean install after using Revo Uninstaller to remove… I’ll see if that makes a difference.
UPDATE:
It looks like it actually shows the values if only viewing the graph itself. Once the Apps tab is opened alongside the graph… it simply states ‘Max’. Toggling back to just the graph results in real values.
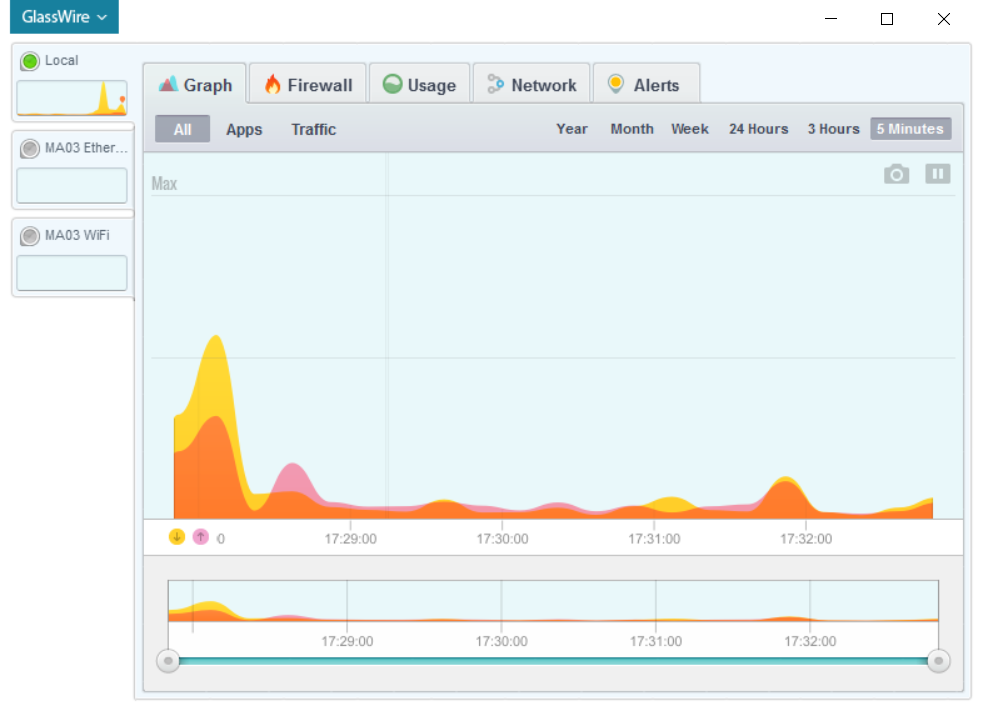
Interestingly enough… I was able to move the time slider along the bottom to new values, i.e (display only in 30 second intervals) and back to 1:30 minute interval and the real values came back. If I place it to 2 minute intervals or higher, just the text ‘Max’ display.
I wonder if it has something to do with the width of the side panels opened. I see you are monitoring other servers/computers. I can open the graph without a side panel (ALL - as I only have one source I monitor) and I can view up to 2:30 worth of interval.
If I open a tab (Apps or Traffic) I can only view up to 1:30.
Seems like some logic gets lost in width of the window view for the graph.
…Maybe?
Try this out… open it up to fullscreen… see how far you can display in the bottom time interval. I was able to do it fullscreen on 1920 and got to 1:45 with the side panel opened (I gained 15 seconds before ‘Max’ displayed)
Without the sidepanel I got up to 2:45 (another 15 second gain)
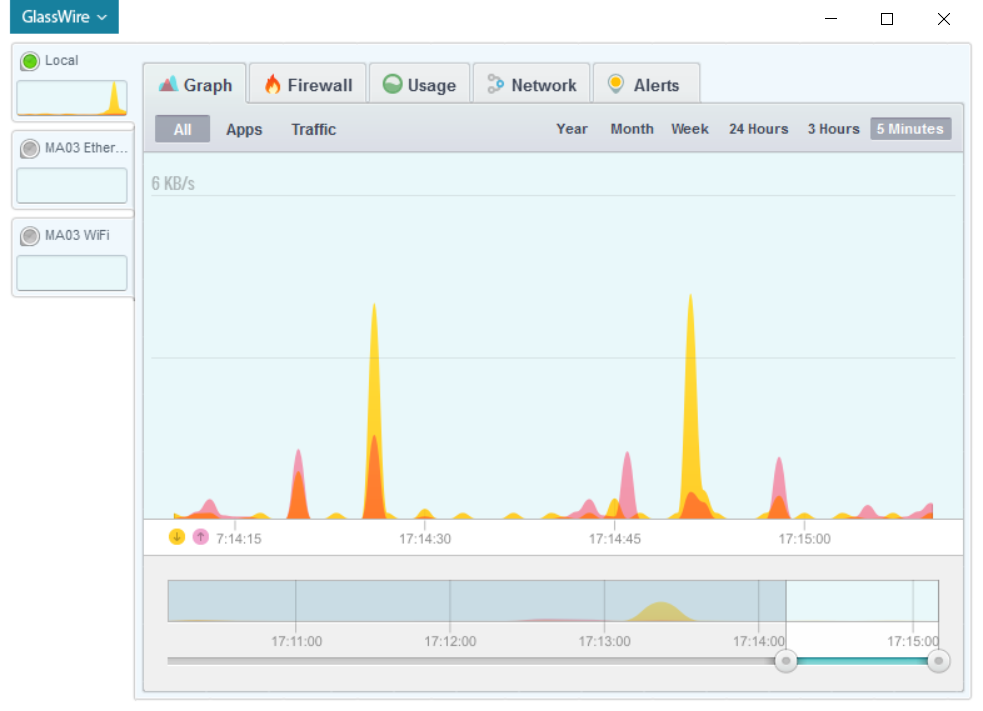
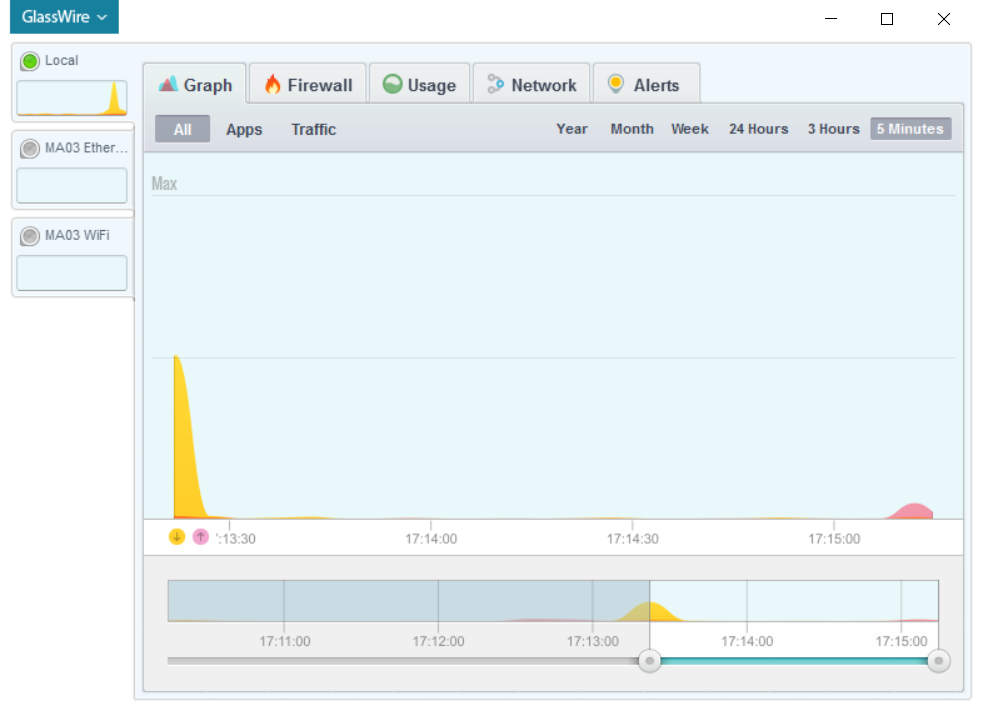
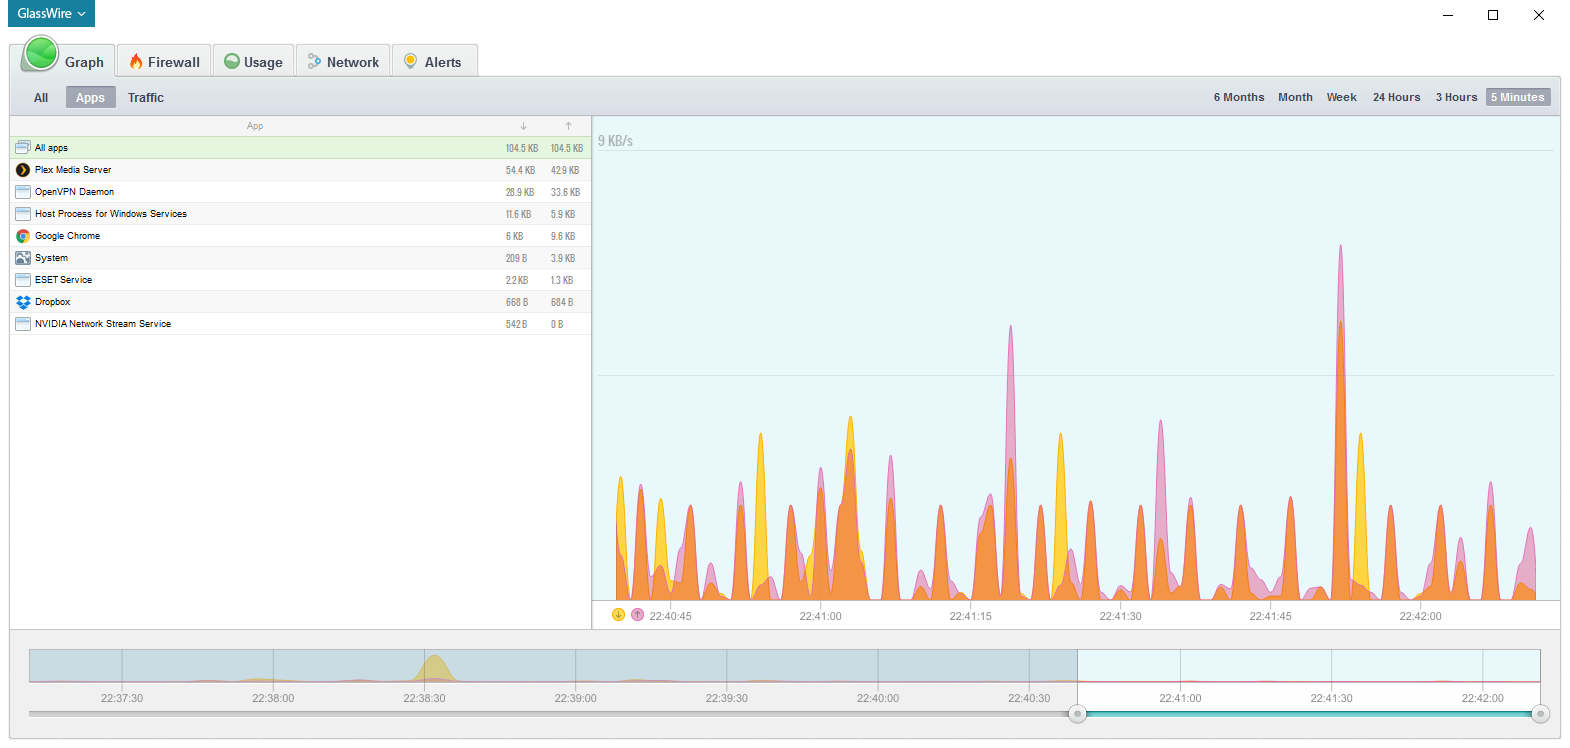
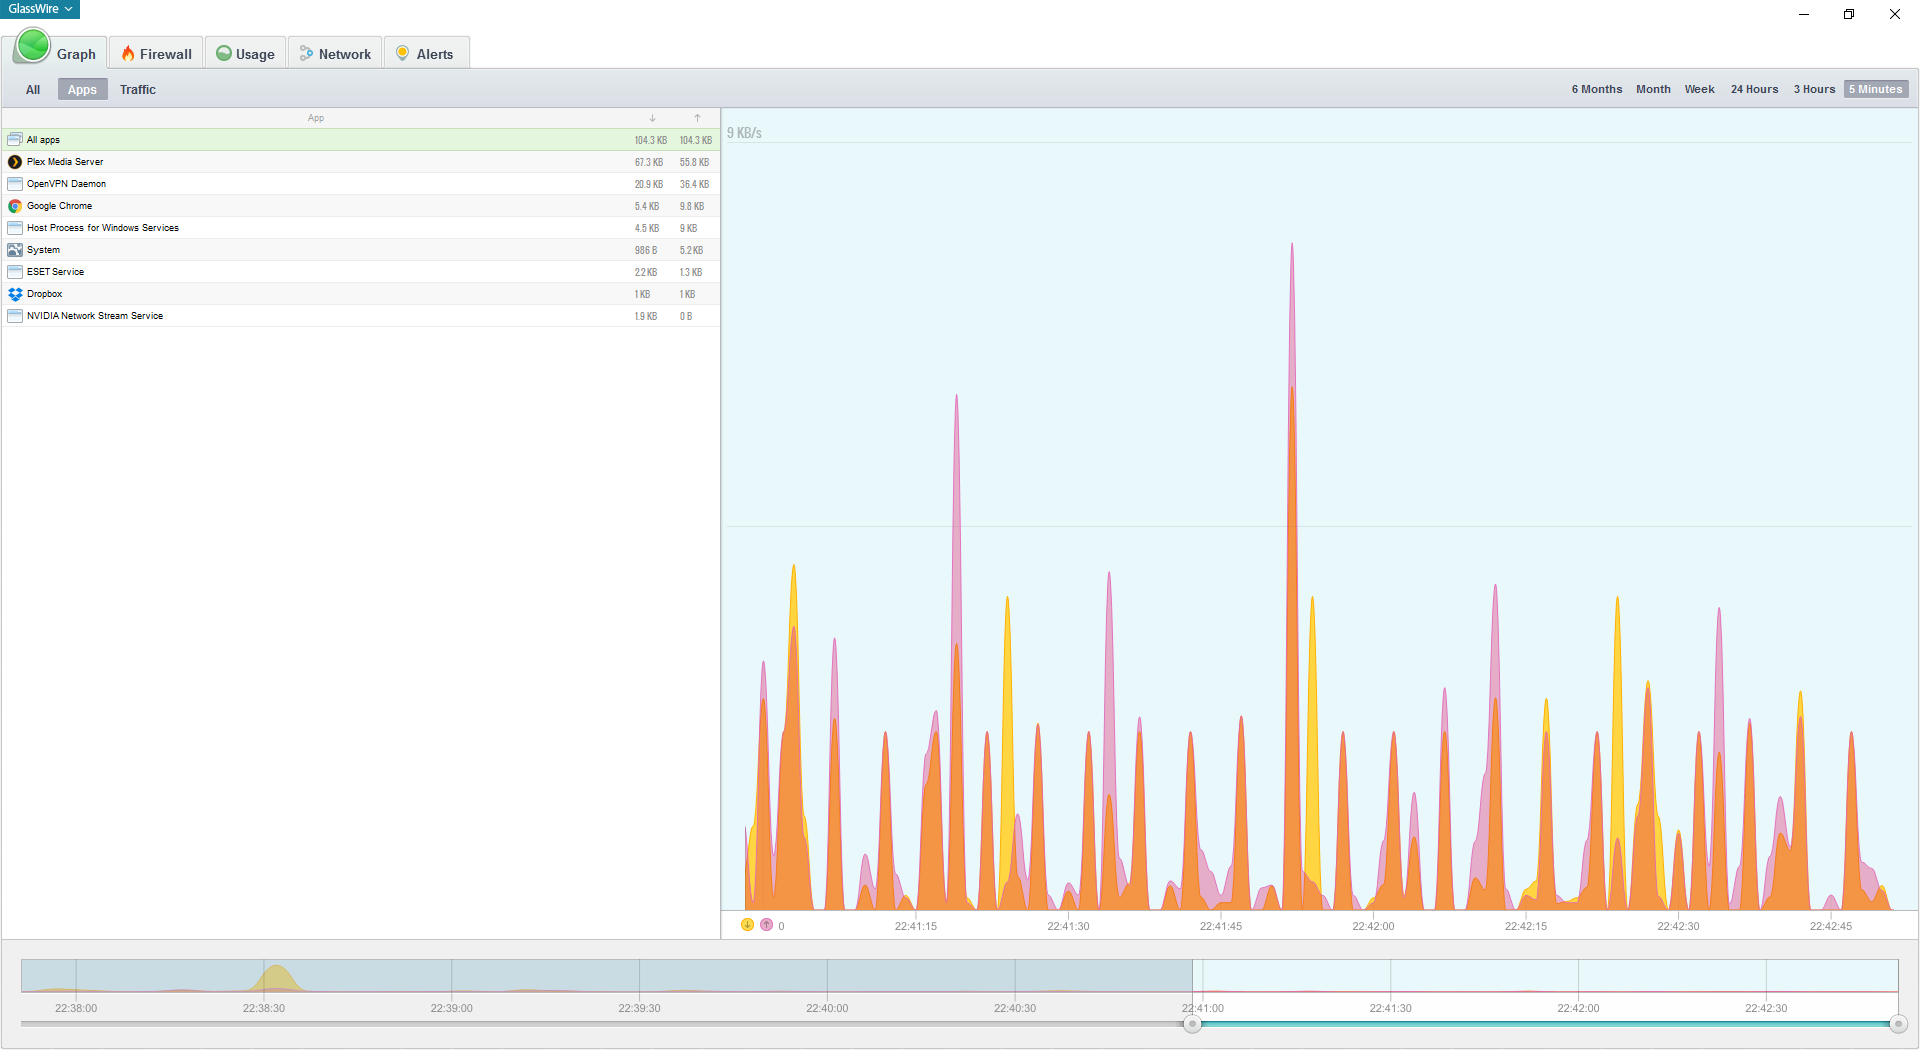
I don’t think that I have the issue you mention. I was trying to get the “Max” throughput label to change to an actual number and found that I had to manually limit the “5 Minutes” graph to the last minute or two.
I can view the full range of “5 Minutes” as shown below.
Correct, it’s not a matter of not being able to view the full range… it’s when the real usage of the network value (in/out) turns to the text display of ‘Max’ instead.