Processor load too high. Windows 10 Pro 64bit v.1809 build 17763.593, GlassWire Basic v.2.1.158 My hardware:
Intel® Core™ i5-8400, Samsung 960 EVO 512GB M2 PCIe MZ-V6E500BW system SSD, memory: 16 GB DDR4 RAM Corsair 16GB (2x8GB) DDR4 2400MHz, motherboard: ASRock Z370 Extreme4, 2×6TB HDD (WD Red 6TB 5400rpm 64MB SATA3 WD60EFRX), VGA: SAPPHIRE Radeon RX 580 NITRO+ 4GD5 4GB GDDR5, computer case: Be Quiet! Silent Base 600
Are you running Bittorrent, or some type of app that connects to a lot of hosts simultaneously? What does the usage look like if GlassWire is closed.
If you’re using our graph and UI GlassWire will use some CPU.
If you are using Bittorrent GlassWire has to count the thousands of hosts you are currently connecting to and that will cause higher than normal CPU usage.
I don’t use torrent client. I use ExpressVPN. Maybe it causes it? No, it is not. I disconnect ExpressVPN, but processor load too high invariably. But see the picture that my internet traffic is low.
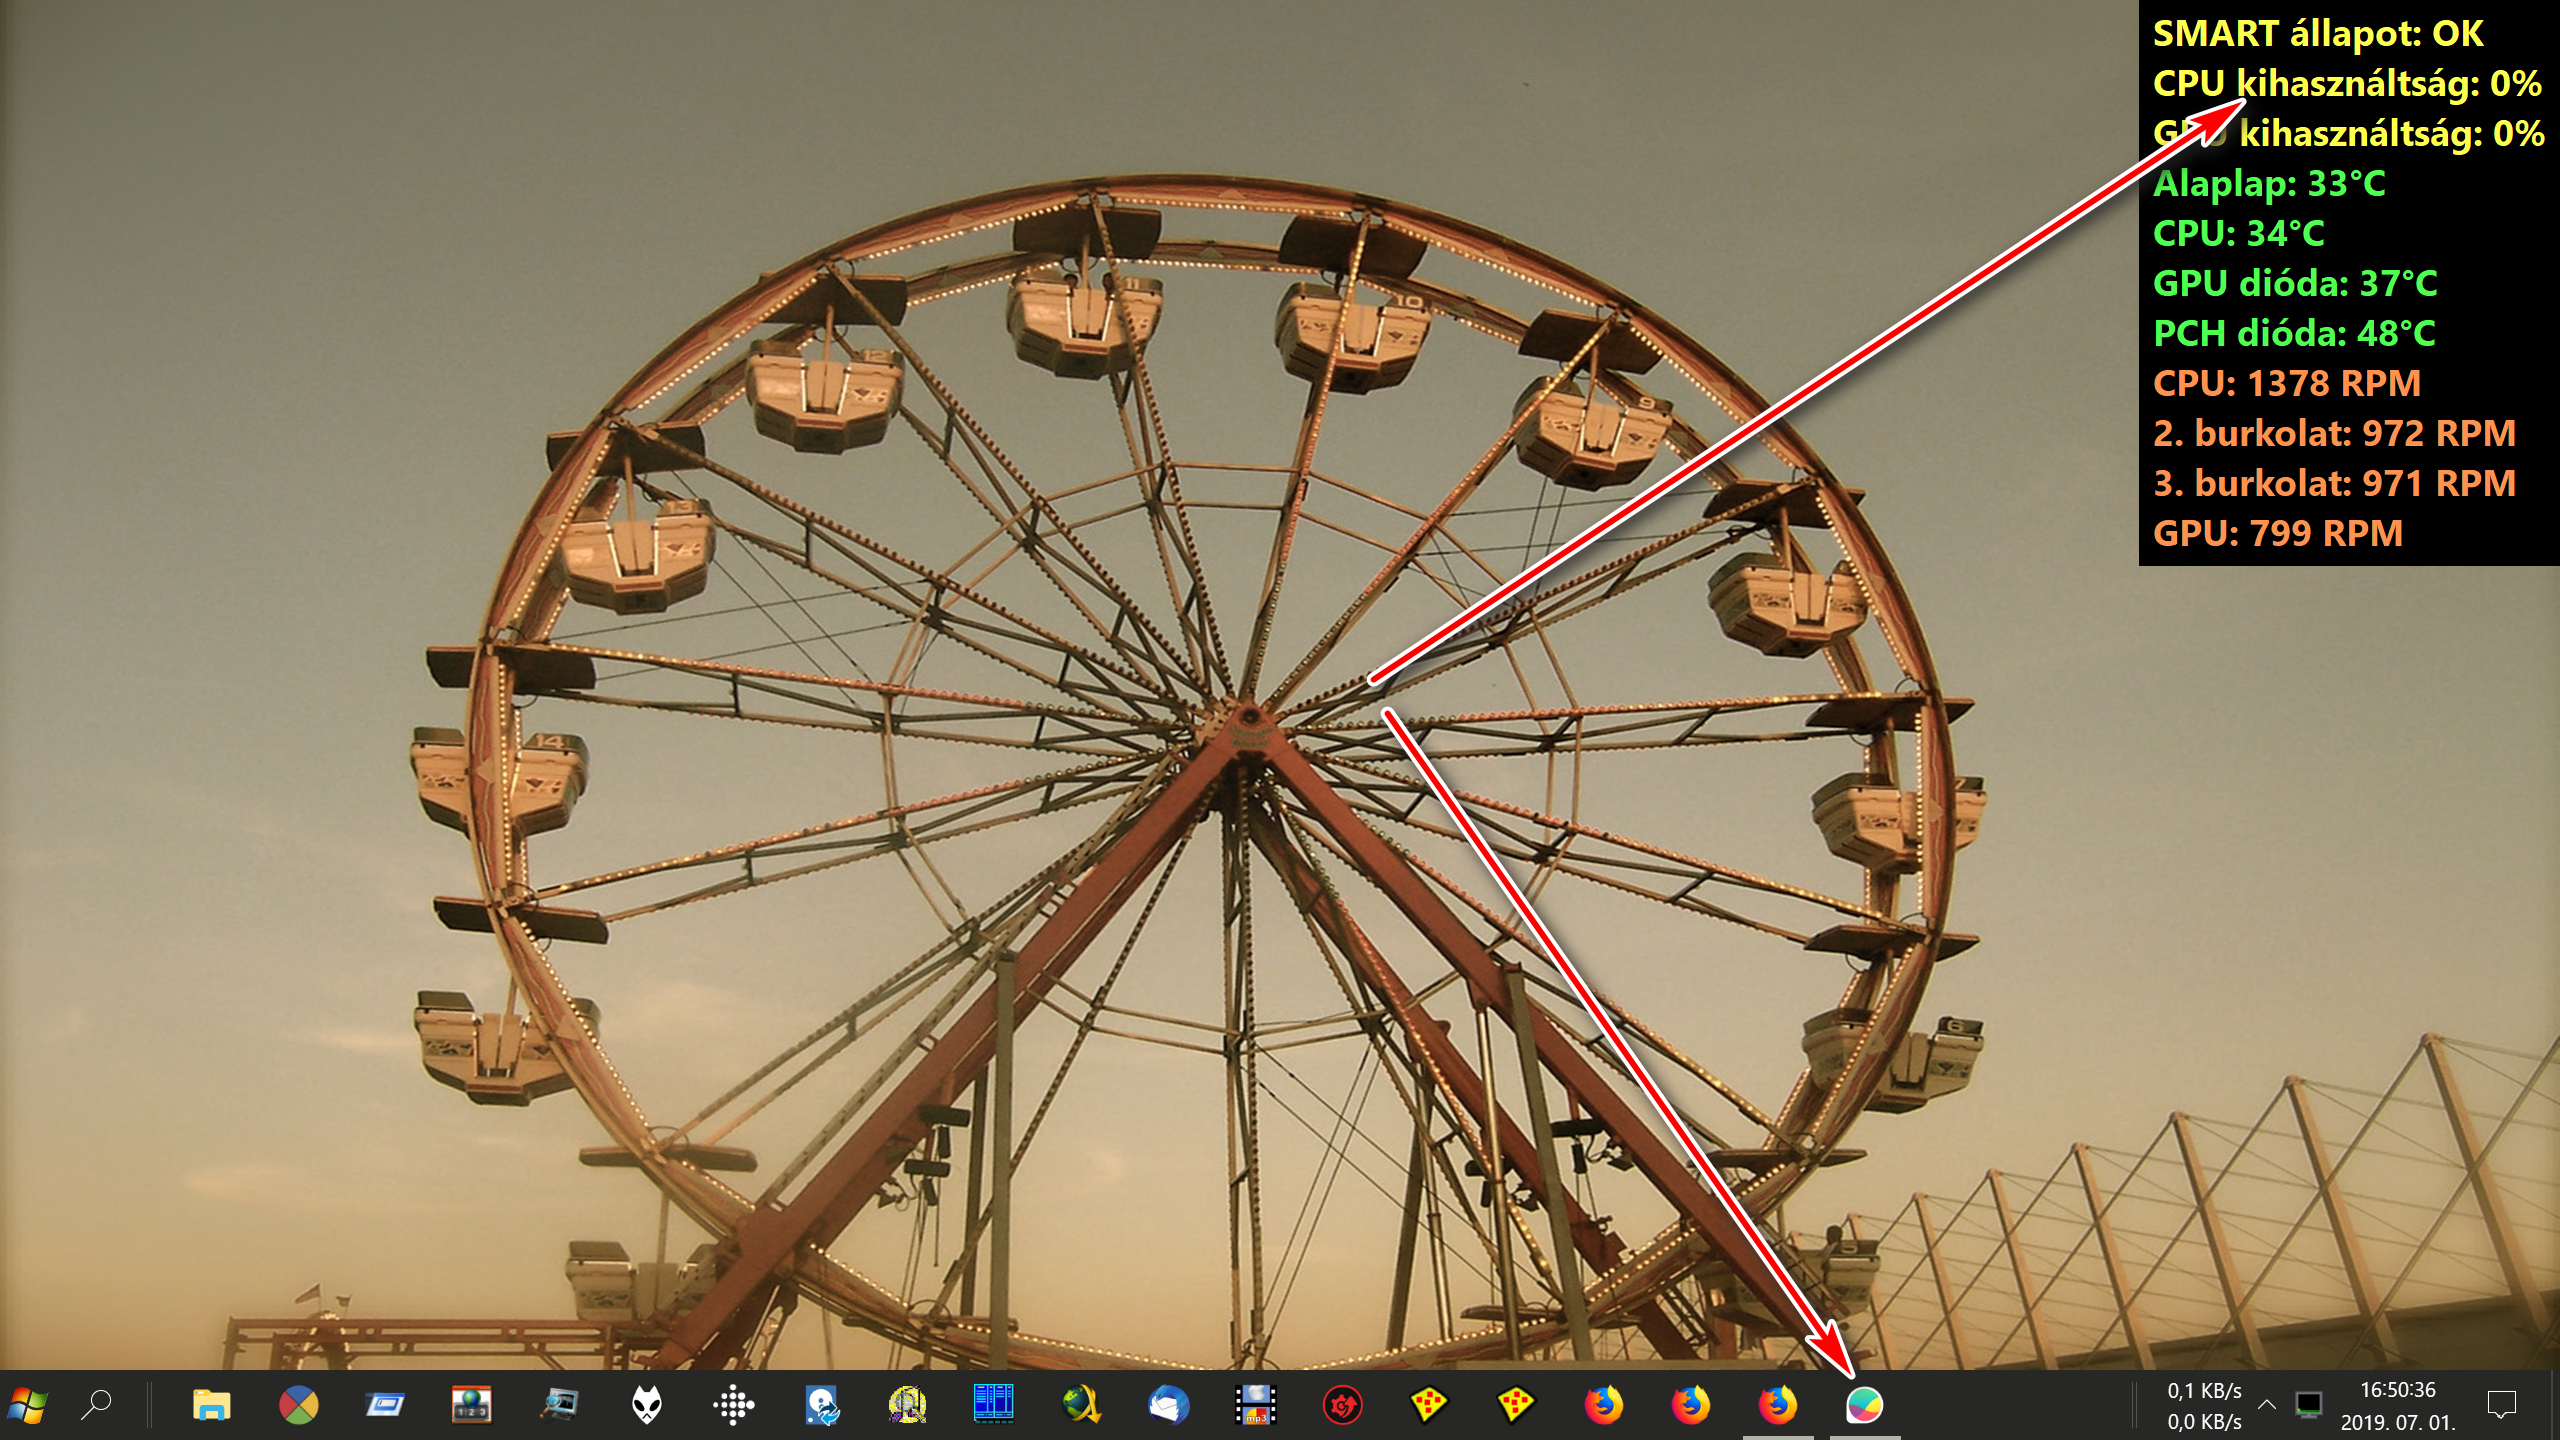
When the GlassWire window is open, then processor load too high . If GlassWire close in System tray, processor load low.


No, a VPN shouldn’t cause GlassWire to use more CPU. I have used ExpressVPN software myself with no issues.
GlassWire will use some CPU when you are actively using it in the foreground, kind of like if you are actively using a game and running graphics there.
If GlassWire is using more CPU than you think is necessary look at the graph then click “apps” and see if there is an app there doing something unusual, for example contacting a lot of hosts simultaneously in a weird way. Usually this is due to Bittorrent but once another person had a similar issue and found he was infected with malware.
If you want to see your graph all the time go to the top left GlassWire menu and choose our “mini viewer”. It is made to use minimal resources while constantly showing your graph. You can also click its little settings icon to make it transparent, or to keep it on top of the screen above other apps.
Malware is not on my computer (adwcleaner, Dr.Web Cure It, Emsisoft Emergency Kit, F-SecureOnlineScanner, HitmanPro, Kaspersky Virus Removal Tool, Malwarebytes). On the other hand, it is only high when the GlassWire window is open. If GlawwWire close on the tray, there is no problem. GlassWire’s graphical interface is the reason.
Running GlassWire’s constantly updating graph as visible all the time will use some CPU.
If minimal CPU usage is very important to you and you want GlassWire’s graph all the time we recommend the “mini viewer” at the top left menu.


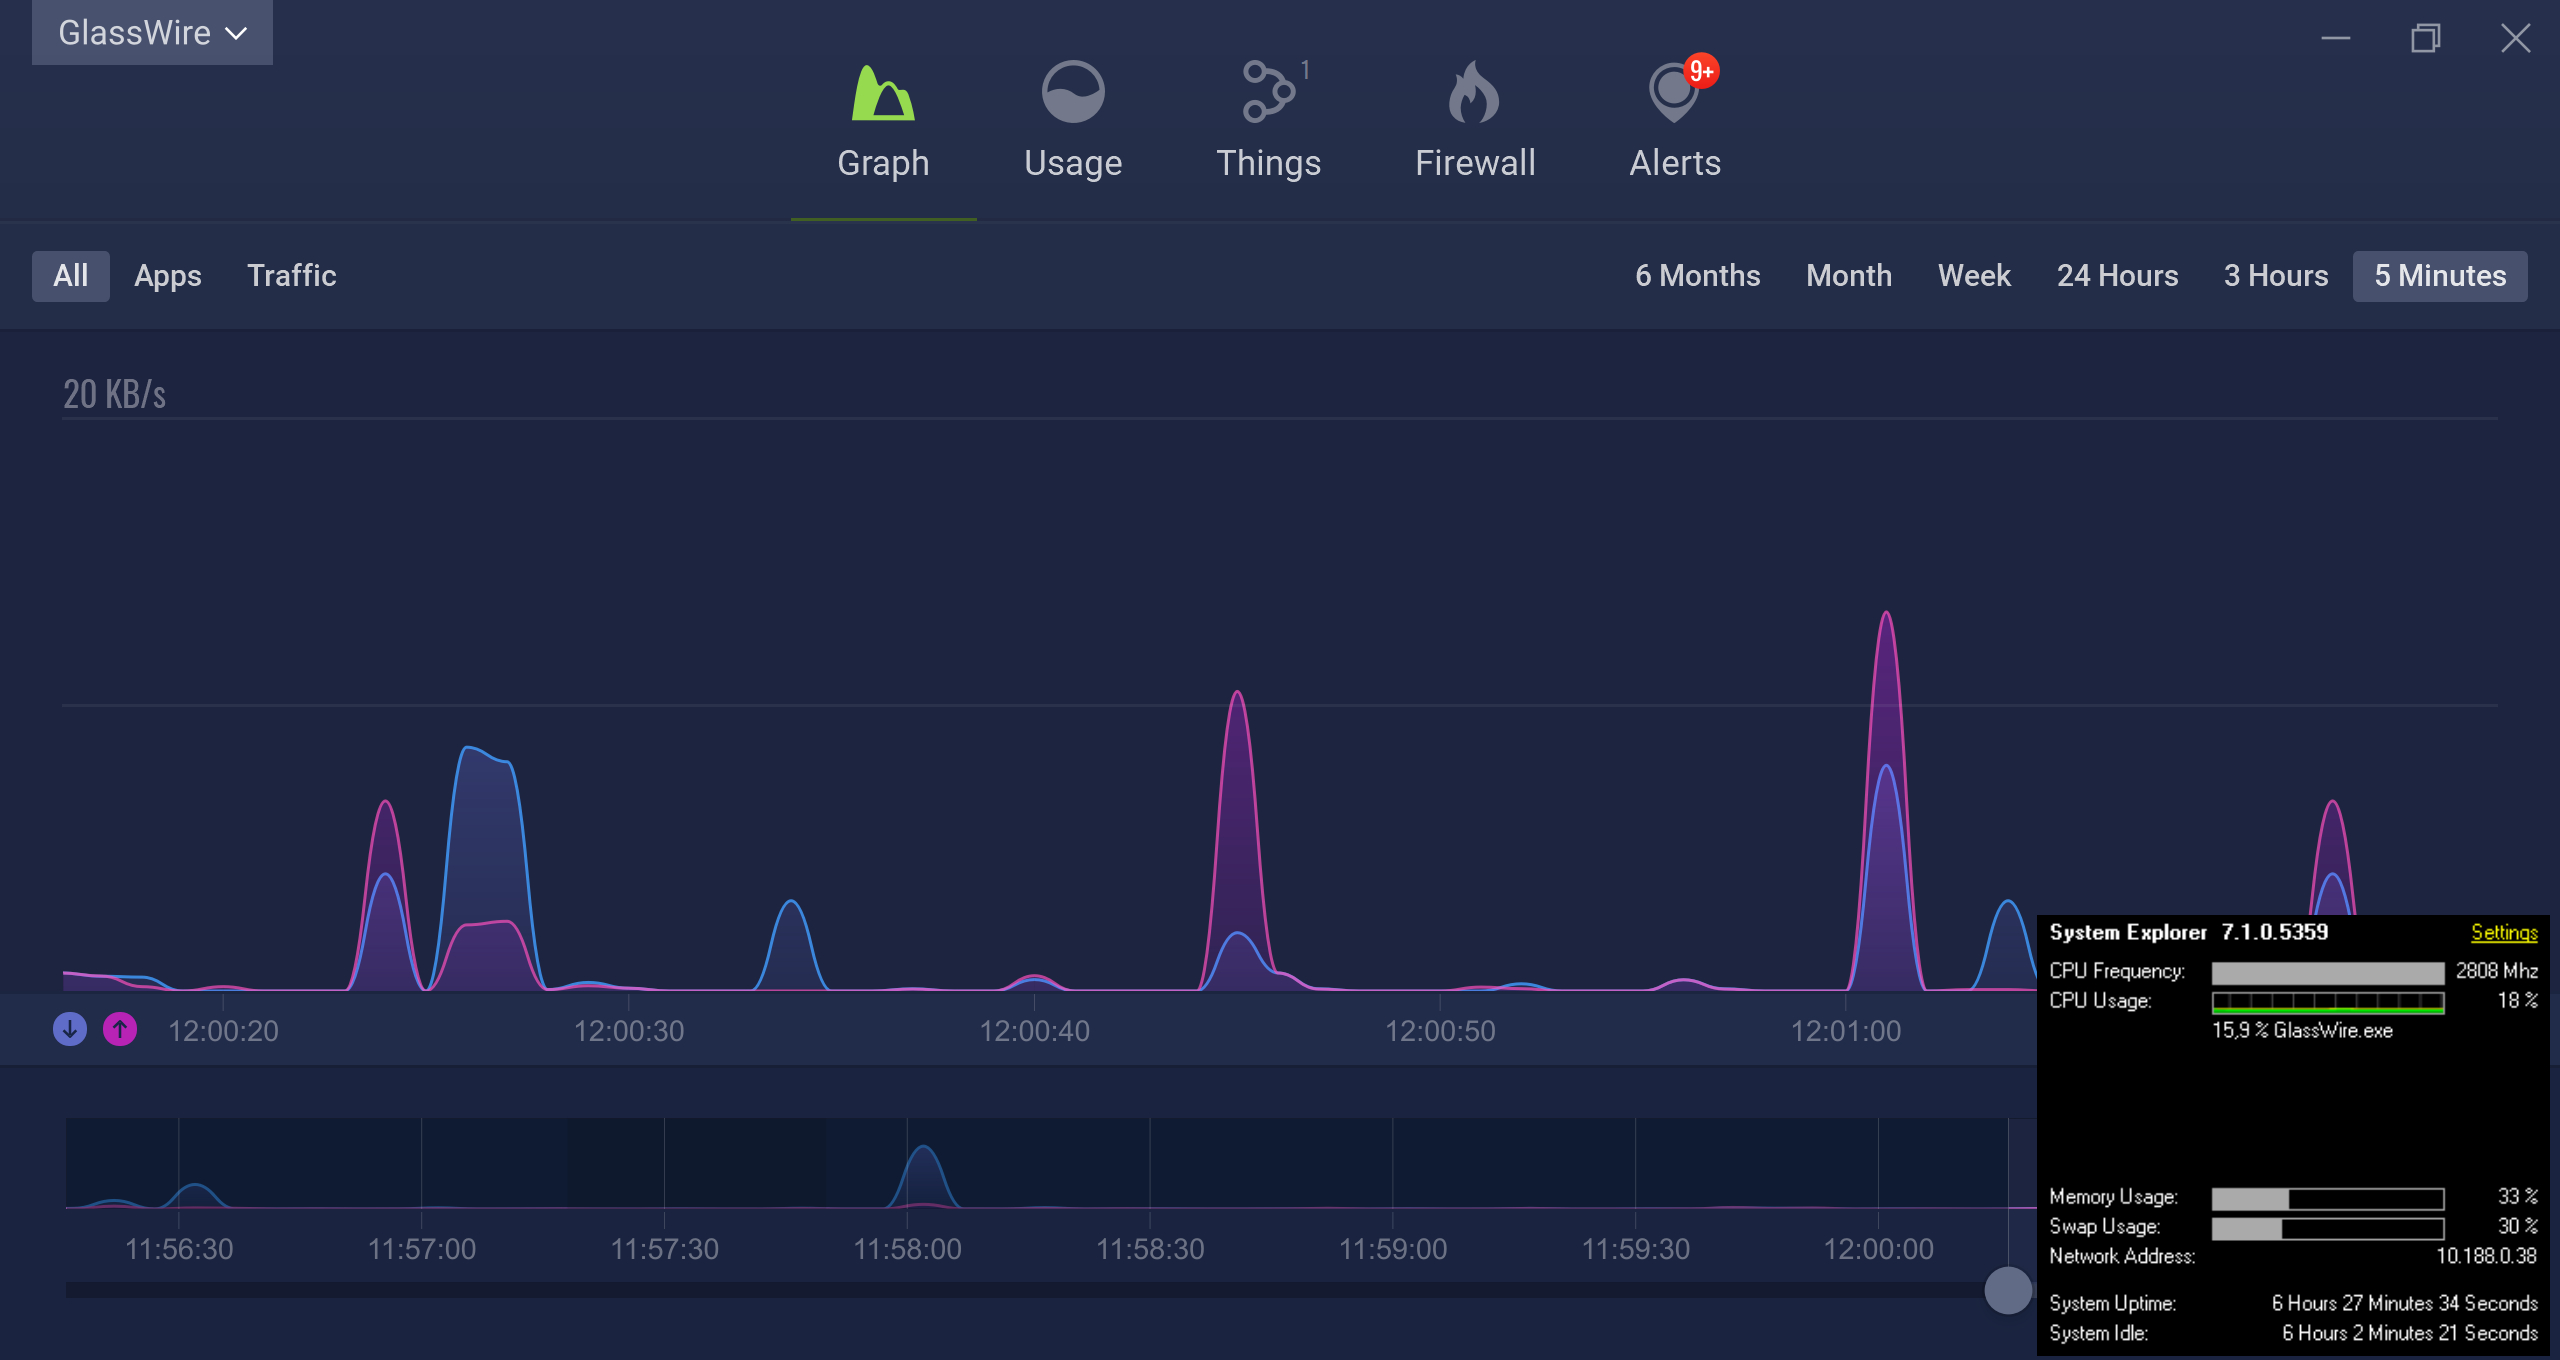
The Glasswire graph view running in the full UI takes about 25% of my CPU. Switching to any other view in the UI drops the use to almost nothing. After closing the UI, the Glasswire application uses nothing when closed, with only the Glasswire background processes running.
So I think it is normal for the full graph view to use CPU, because it is constantly updating. So it’s probably not something that needs to be running all the time anyway, especially if you are working on something else.
1 Like
"So I think it is normal for the full graph view to use CPU, because it is constantly updating. "
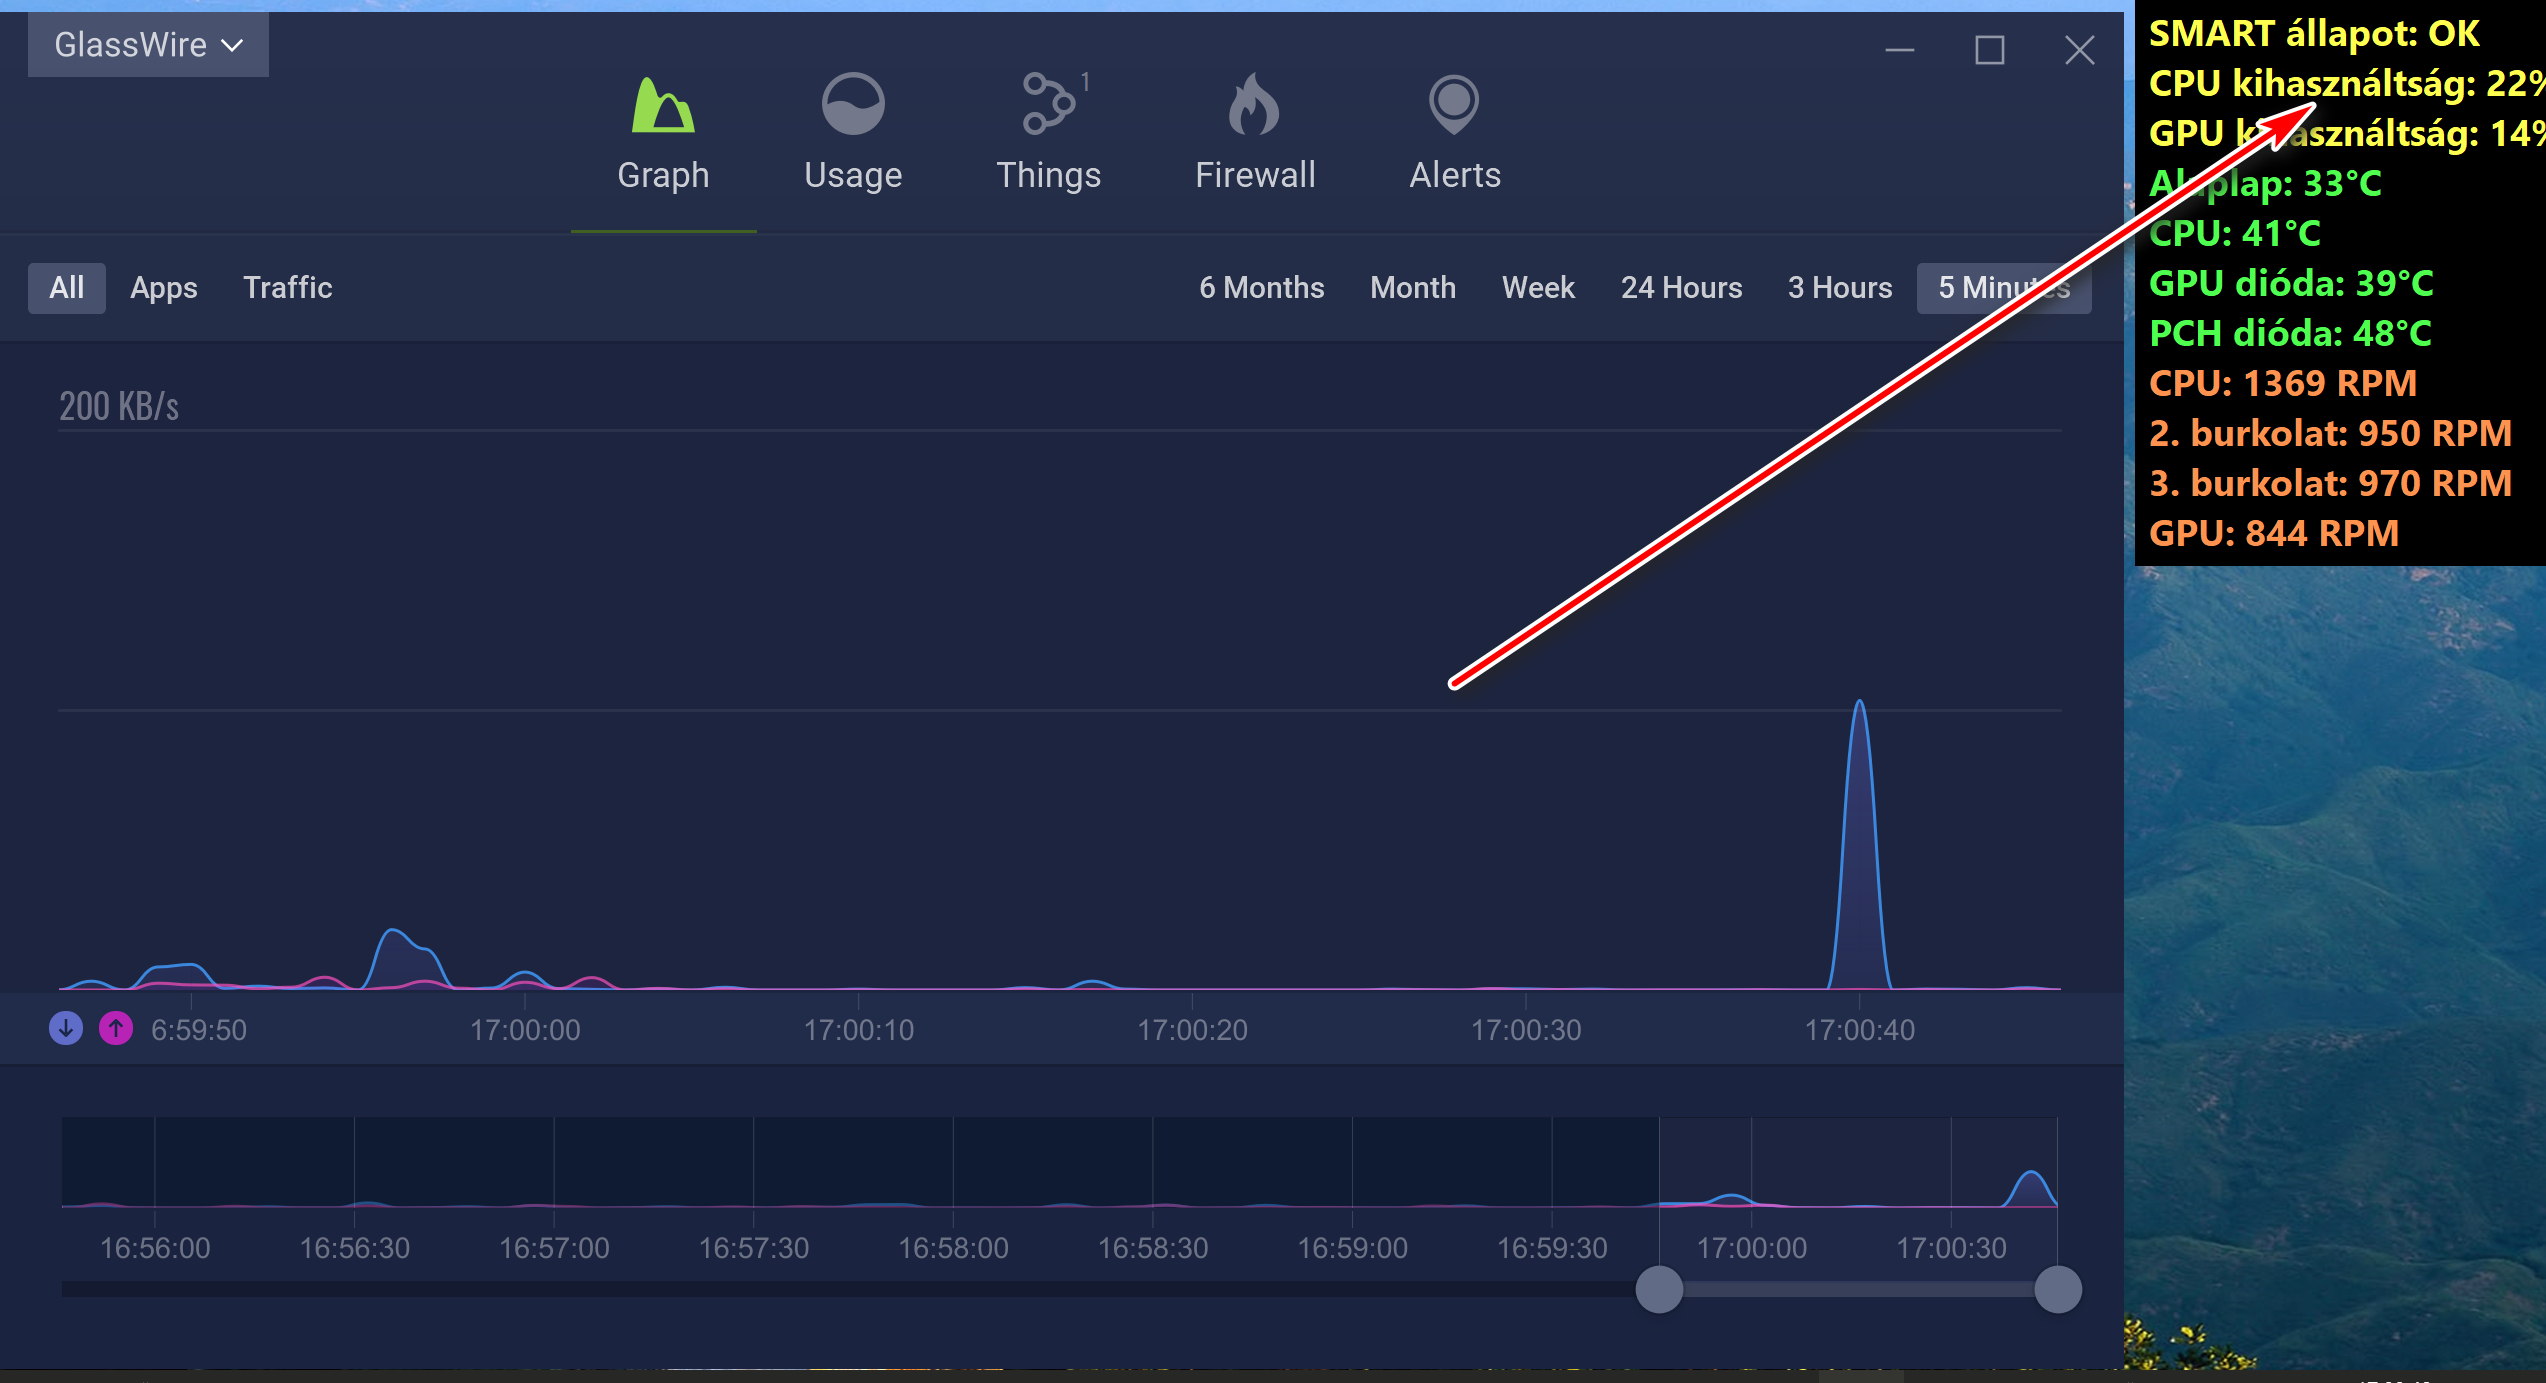
No, Because the interface is not refreshing now, but the CPU load is still high.

The app would need to be processing and updating the data for the display, regardless of whether you pause the animation. You should observe that the timeline is seamless and no data is skipped regardless of when you pause/resume the animation.
It obviously needs to buffer and hold it so that you can resume the display at any time. So that would be the real work, as the actual number crunching part is probably non-stop.
But rendering the animation graphic is probably not loading the CPU significantly, as that task should be off-loaded to the GPU.