Hi GW,
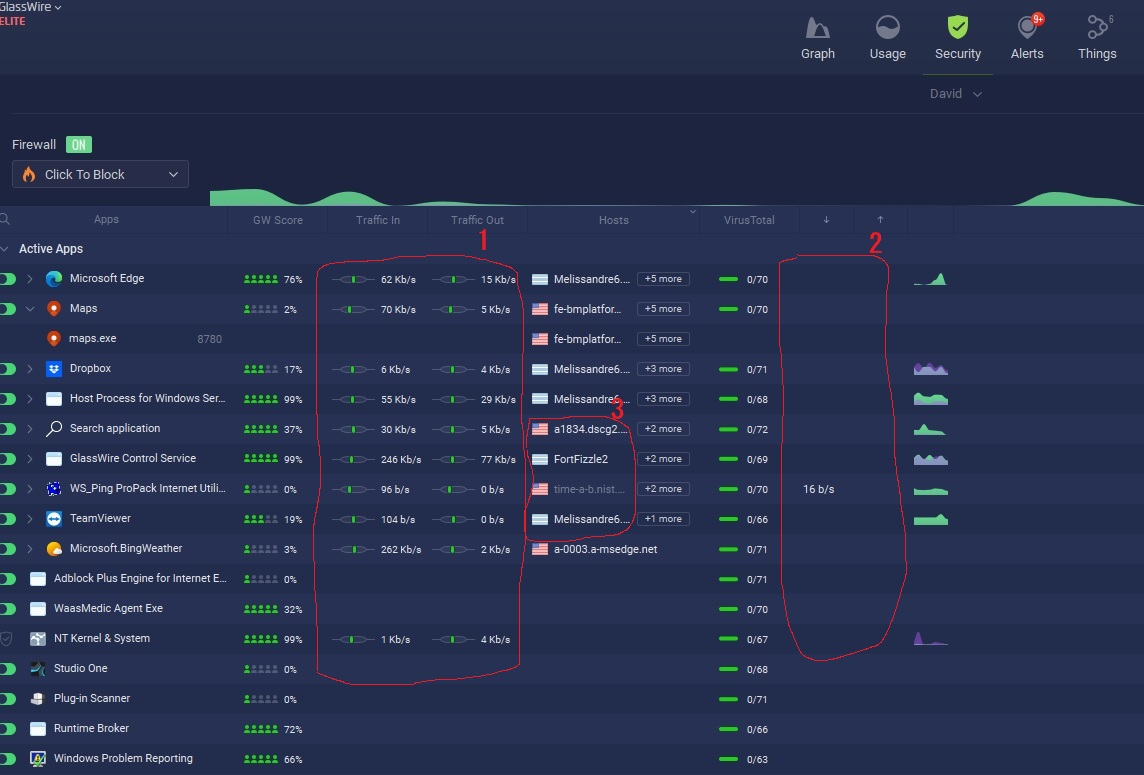
On the main window’s Security Tab (formerly Firewall Tab), there are two pairs of columns that appear to show data rates. The leftmost pair are labeled as “Traffic In” and “Traffic Out” (“1” on the screen shot). The rightmost pair are labeled with up and down arrows (“2” on the screen shot). Can anyone tell me what the difference is between the meaning of the data shown by the leftmost pair of columns and that shown by the rightmost pair? What are they supposed to be showing?
Also, in the section labeled as “3” on the screen shot (in the Hosts column), what is the meaning of a host that is shown in illuminated (or lighted) font? How does it differ from a host shown in a “normal” or not-illuminated font?
As I recall, it was a fairly easy thing to get myself included on the list to test the GW Betas. It seems I saw something about it on the forum awhile back and responded. As a starter, you might try searching the forum for the word Beta. or send email to the Help Desk.
Thanks, but beta testing is of no interest to me. I prefer an old stable product in my environment.
I just always thought beta testers were supposed to keep their feedback within the beta team members, hence my question about you discussing it on a public forum.