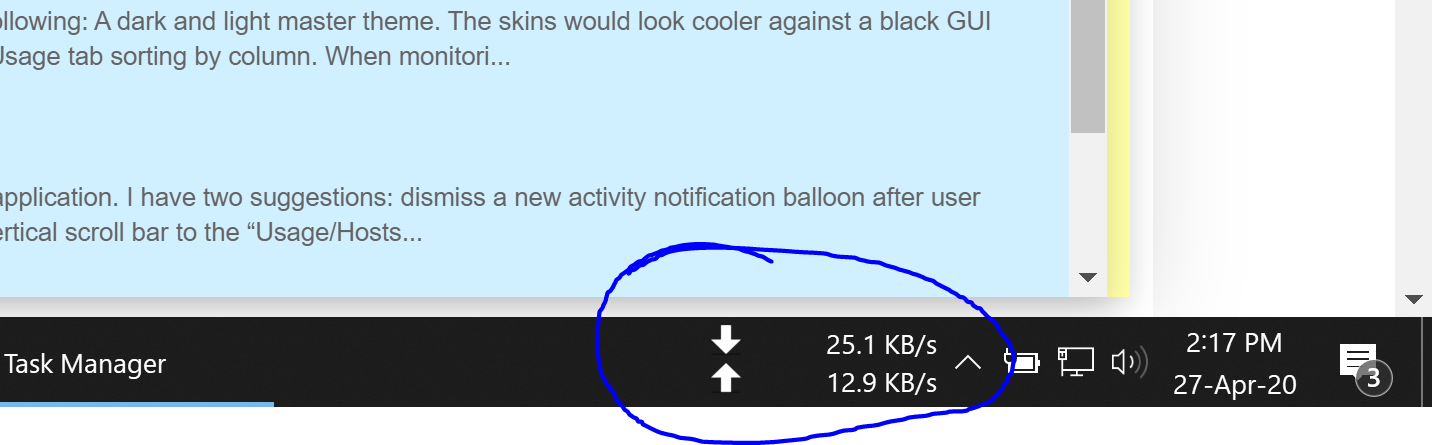
It’ll be amazing to have a toolbar that displays Usage Graphs and/or Speeds as numbers.
2 Likes
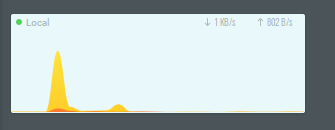
If you go to the top left GlassWire menu we have a “mini viewer” option there that can show our graph along with a speed meter. It can be made transparent, and you can make it float over/under other windows.
We also want to add a speed meter in the place you show but Windows has no official API to do so. We try to avoid adding hacks to our software for security reasons, plus Windows can update and suddenly the feature is broken or removed and there would be nothing we could do about it. Then everyone is angry with us “why did you remove that feature!!!” when we didn’t…
Hi ken, thank you for the reply. Yes i have been using the mini viewer. I just thought we can do something like i showed in the above pic. Its actually from DU Meter that ive been using since 10 years lol.
I though it would be great if even glasswire could do so 
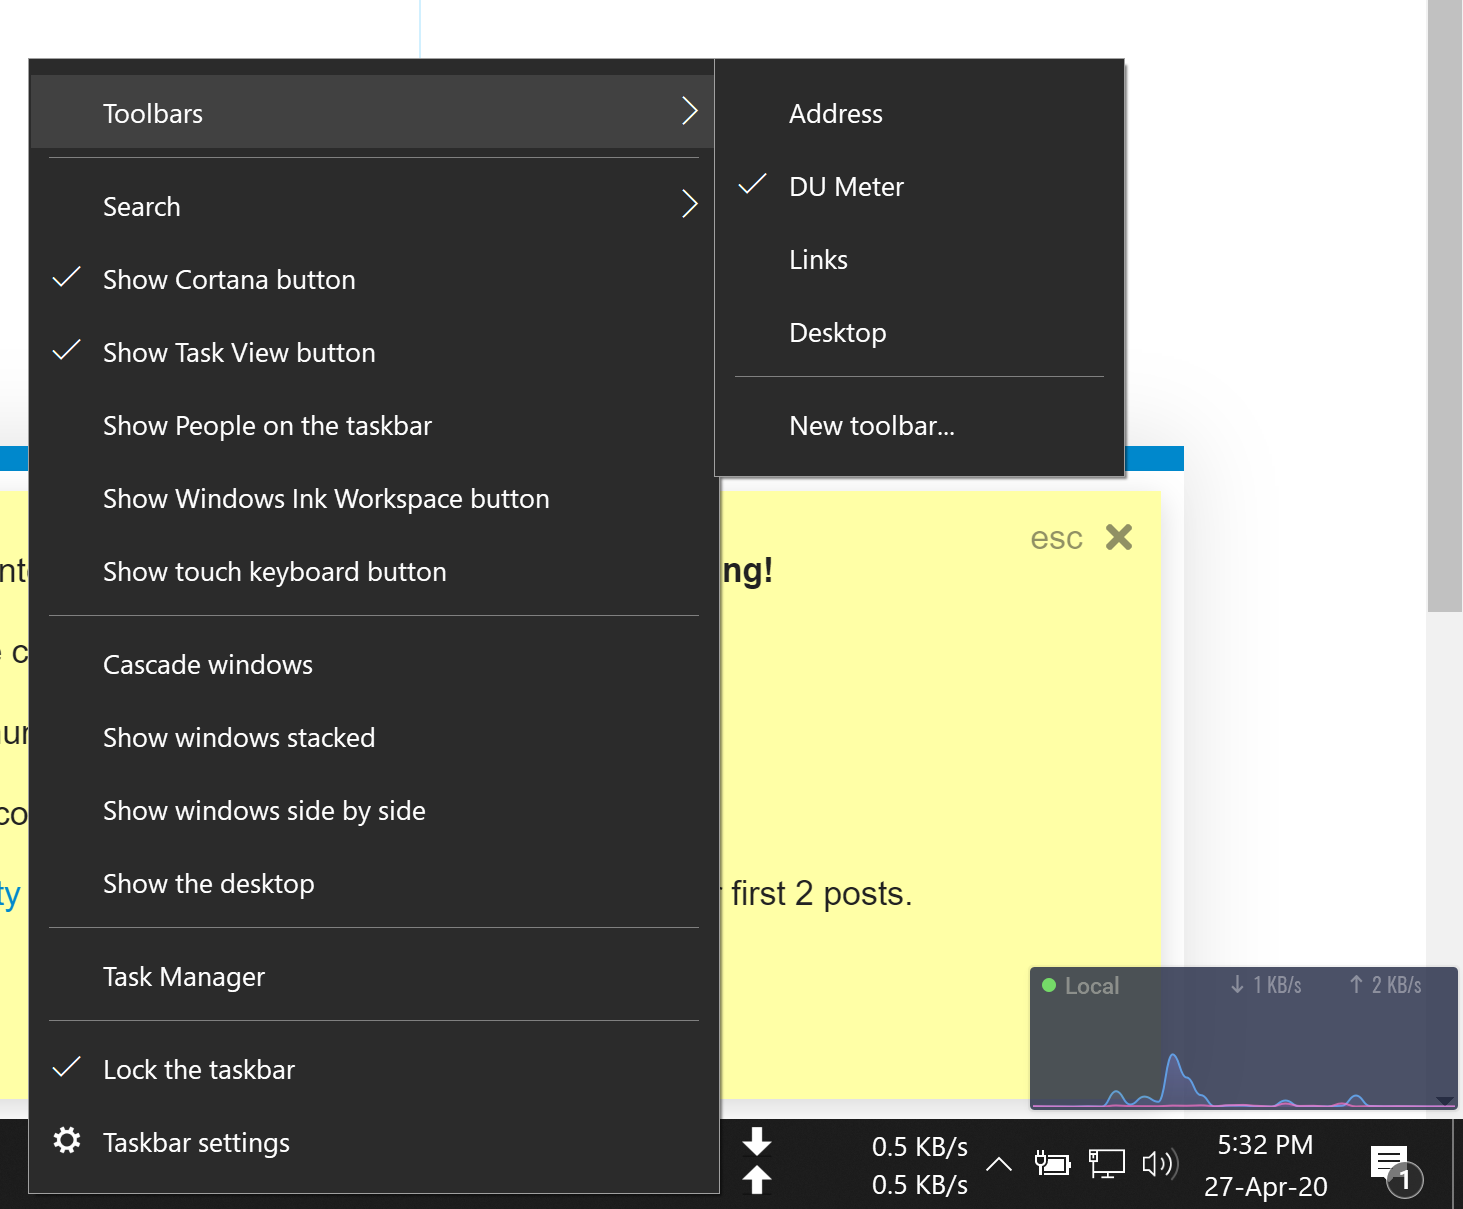
It gets activated by the “Toolbars” section in windows. I am sure there is some way to get it done.
2 Likes
Yes, we looked at that app and studied it. It’s a popular request but due to it being a hack Windows may break it sometime in the future.
I hope they will offer a dedicated API for this feature because I want to add a graph there actually along with a speed meter.
Ahh i see, thanks for the swift replies. Hope to see a windows API in future lol.
1 Like
We have found if you implement hacks they randomly break with future Windows updates, then everyone who can’t use that hacked feature anymore get very angry! 
It’s not fun.
How does Networx display a toolbar graph? I have used it for nearly 10 years without issue, but recently bought glasswire and much prefer it’s functionality. I would love to be able to uninstall Networx and use glasswire entirely, but the toolbar is extremely useful to me since it doesn’t display over other windows.
Another work around for this would be giving the option to hide the top bar (with the close window button) on the glasswire mini viewer, and be able to unlock the window size proportions so we can make it wider/taller. Then we would just be able to fit it over the taskbar and it would work all the same.
Just a thought! Thanks!
1 Like
Thanks for your feedback.
It’s a bit of a hack to do that, but not impossible. I guess our fear is that eventually Microsoft will make changes then that “hack” will no longer work, and people such as yourself will be angry with us that we removed a feature you enjoy.
We try to stick to documented and allowed development options in Windows and Android because we have been burned in the past (mostly burned on Android unfortunately).
Thanks!
Replying here to avoid opening a new topic…hope it gets noticed ; )
I want the mini-graph-in-Taskbar too. The explanation above for why that’s not feasible makes sense though, and I understand the situation.
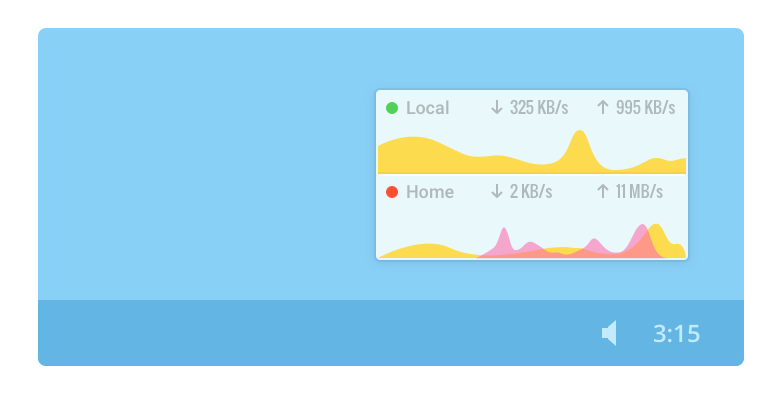
However, @SKKings made a VERY good suggestion that I fear was overlooked: Make the minigraph resizeable in proportions so it can be “long and skinny” to fit “on top” of the Taskbar. I was pleasantly surprised when I realized that the minigraph does indeed go over the Taskbar already, but of course it’s too tall to perfectly fit. This might mean creating options to toggle whether the proportions are locked or not, and maybe also turn on/off the up/down numbers – or the graph itself – for a more compact display that fits the space. This would add to the configurability of the minigraph even for users who don’t want to put it over the Taskbar, too. Someone who just wants the up/down numbers by themselves, say in the bottom-left of their screen – they could do that with these controls.
I don’t care about the numbers; I use the minigraph as a general activity indicator; it’s basically a stand-in for the orange and green LEDs on my ethernet port (which I can’t see, obviously). I use Glasswire to actively manage my data consumption because I’m on a capped dataplan – when I see a big swath of color I know something is hogging my data. But there is literally no place I can put the minigraph that’s not in my way somehow – except “over” the Taskbar.
There is also a kind of bug related to this: the mini graph doesn’t stay “above” the Taskbar reliably; after switching apps and clicking different windows a few times, it falls behind and I can only see it’s title bar poking out. It does remain above other apps, just not the Taskbar.
I think these changes would improve Glasswire on the whole, especially since the tool is targeted at users who want an attractive and intuitive interface (that is also powerful and robust).
2 Likes
Thanks for your feedback.
If you click the little settings icon in the mini viewer near the top right X, and then choose “keep mini viewer on top”, does the window still move around on you?
I do have that setting selected. The mini graph stays “on top” of other apps pretty well…every once in a while it does slip backwards but not often enough for me to really complain. It might be connected with toggling certain apps to ‘fullscreen’ and then out…I haven’t tested it exhaustively.
However the Taskbar appears to be an exception; the mini graph will still be on top of every other app, but tends to fall ‘behind’ the Taskbar. If it helps you to fix the problem, I’m happy to spend some time to identify specific steps to reproduce, but today I don’t know exactly. I just know that over the course of 4 hours computer use, the mini graph is guaranteed to have fallen behind the Taskbar. That is frequent enough that I can’t risk leaving it over my Taskbar because of course then it doesn’t function as a “high usage alert” because the graph is obscured by the Taskbar. The numbers still peek out, but that doesn’t get my attention like a big swath of color does.
1 Like
Now i update win10 and stop working du meter  , XMeters and netspeedmonitor have the same funtion… But if glasswire implement we be great
That’s unfortunate and frustrating! I’m sorry to hear Microsoft did that.
I think the reason that app stopped working is the reason we never supported the same functionality. Putting a graph in the Windows taskbar is not documented and it’s kind of a “hack” with Windows. So if we would have supported this feature then our app would currently be broken too and our forum would be filled with complaints.
Instead we have the “mini viewer” under our top left GlassWire menu. You can put it wherever you want, keep it “on top” or even make it transparent. You can also make it any size and none of this will be disabled randomly in the future by Microsoft.
We have done “hacks” in the past with other apps and it always turns about badly, and it randomly gets disabled so we have found it’s not worth it.
Ken thank you for this well-written response and explanation. The choice your team made sounds smart.
If things change in the future to where this is possible though, it’d be real nice : )
1 Like
Please let us know if that other company was able to fix the issue or not. Maybe there is an official API now that can do what we need, and if there is we’ll try to add a similar functionality.
I noticed that in the latest update Microsoft added a weird weather thing there…
I am trying to understand you now. that putting it on the taskbar is a hack. Ok its fine.
Now if I am to use the Floaty windows could you atleast give an option to be able to NOT DISPLAY those histogram/curves…
I means its supposed to be minimalistic… just only to show numbers
Having colorful animated graphs really mess up my Desktop setup.
I would totally move from DU meter and Net limiter for this. Only if the mini will display only numbers and having a bright color(whitte) fonts
NO Graphs or animated graphs
Thanks for your feedback on removing GlassWire’s graphs where it only has a small speed meter.