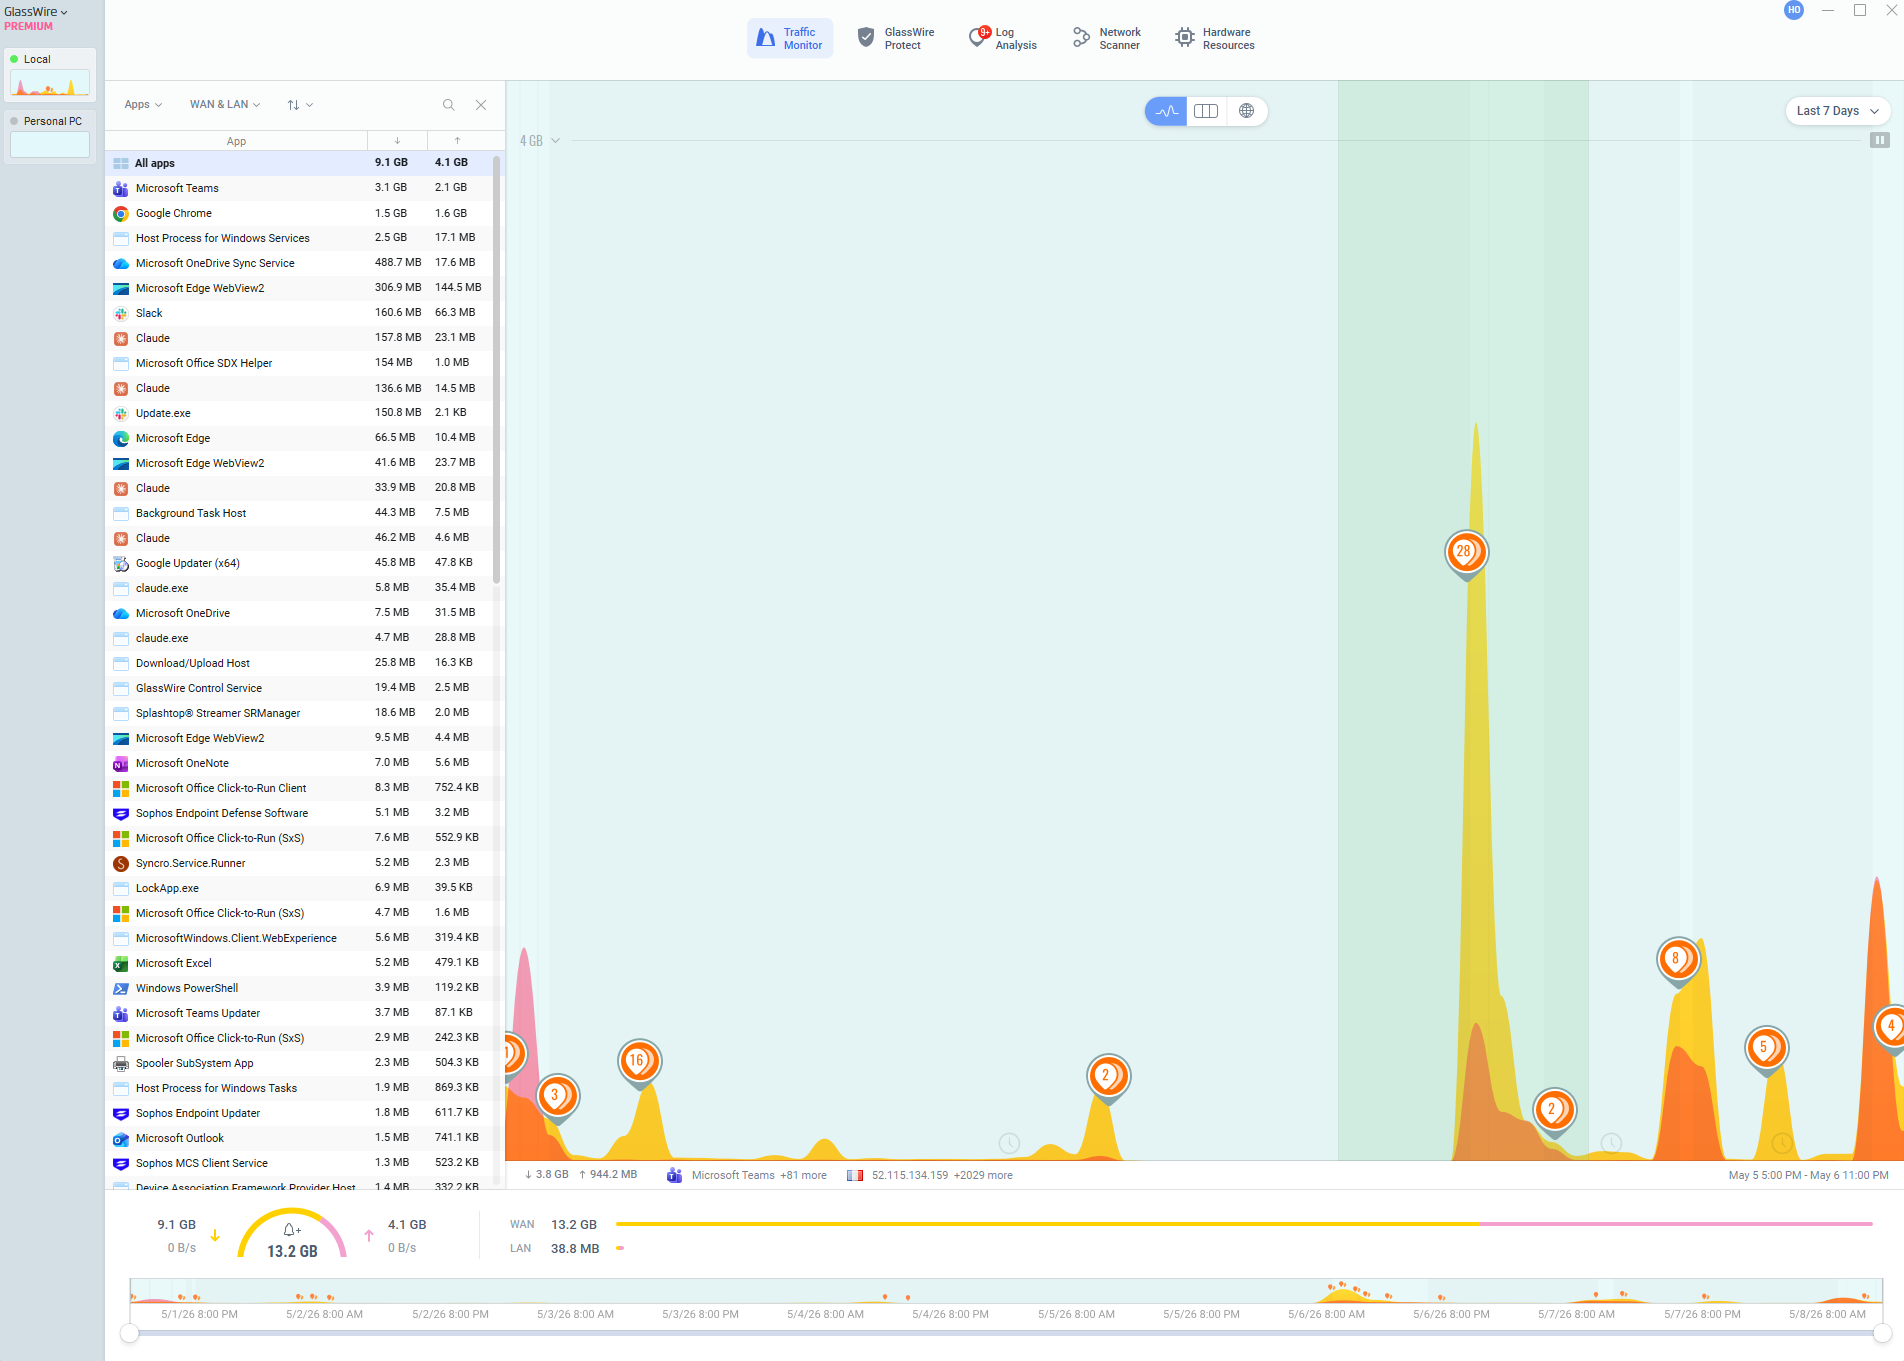
When selecting “Last x Days” how can I see a summary showing the total of GB consumed by day ?
Hi @Corobori - Are you referring to the Traffic Monitor feature? If so, there currently isn’t a built-in table or report that shows a day-by-day GB usage summary when using the “Last X Days” view.
However, you can use the graph itself to narrow down and inspect a specific period:
- Click and drag across the graph timeline to highlight the timeframe you want to inspect.
- Once selected, GlassWire will zoom into that range and display the traffic totals for the selected period at the bottom of the window.
- You can continue narrowing the selection to isolate a single day or smaller time window for more detailed usage information.
Here’s an example of selecting a range directly on the graph to view the corresponding traffic totals.