Hi all glasswire users and IT support. Please assist as the following does not make sense.
I logged in at 2:15pm today and my last active day online was the 9th of June. I was not active yesterday. Glasswire’s 24hr data usage reading is 235MB of data used. How is it possible for that amount of data to be used if I was not online for the entire day yesterday and only went online at 2:15pm today?
Was your computer off prior to your noted time? How many minutes was your computer turned on prior to noting that 235 MB of data was used?
It is not terribly unusual to use a couple of hundred MB over a short period when your computer is turned on. Just a signature update to your anti-virus could account for most of that.
Chris
On a 24hr setting, the usage metre resets to 0 at midnight. I was not online (no internet) at all yesterday (10 June) ,that is, I was not connected at all until now at 2.15pm, and the usage ‘metre’
starts off at 235MB? That makes no sense.
The cool thing about GlassWire is that it shows you what apps were using the data, and you can see details. Go to the “usage” tab or our “graph” tab to that data period, then see what apps/hosts were using the data.
https://www.glasswire.com/quickstartguide/
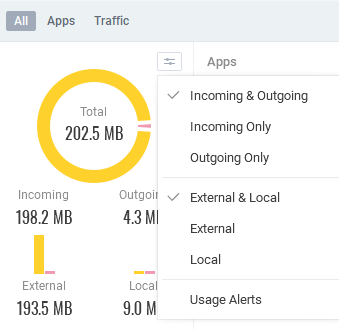
Also, if your computer or network was completely offline perhaps you are seeing local network usage? Is your “usage” tab set to show “external and local”? Maybe just show external?
1 Like
I had just switched on . If I launch a browser immediately after booting up, would that amount of data be used?
If the browser updated, or if you use a lot of extensions it will use data. Or even if the browser did not update and you launch a browser it will use data.
You can see this live on our graph after launching a browser. Look under “apps” then click the browser name and watch its data immediately after launch.
1 Like
I will monitor that, thanks.
I would really not be surprised if it is something other than your browser. Could be Windows Update. Could be an anti-virus Signature update. Could be a any number of background processes running.
As Ken mentioned, in GlassWire can tell you what is using the bandwidth. In GlassWire’s main window, choose “Usage” across the top and then click “Apps” near the top-left.
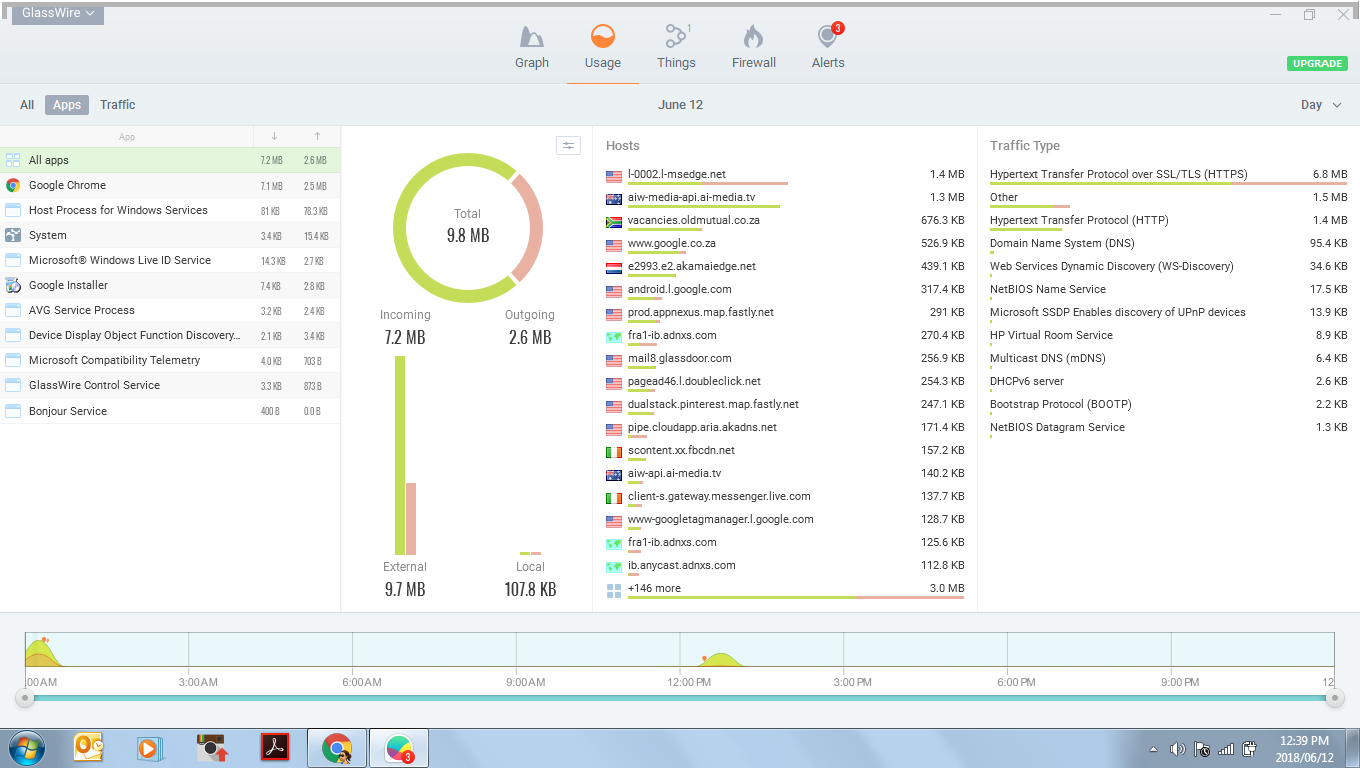
I decided to try this again today. I’ve just logged on and I’ve just launched my Chrome browser and all the usual ‘apps’ have loaded - same conditions as yesterday and the Glasswire usage reads as follows (screen shot below). Yesterday, the immediate reading was approx. 235MB. Can you explain that?
Yesterday, was the 235 MB all (or mostly) used by Google Chrome?
Even on a high speed connection, 235 MB should take at least a minute or more. Was Chrome slow to load? If the traffic was all Chrome, I would suspect perhaps an update to Chrome automatically coming in.
Although Chrome loaded at a normal rate of speed, it is probable that a Chrome update was the cause of the data spike
The topic title accuses GlassWire of being inaccurate when there is no evidence of that in any of the detail you provide. So I’ve amended it to make it more accurate.
You haven’t used GlassWire to show what has contributed to 235MB of traffic. Instead you show the data for a different day which, at 10MB, only explains about 4% of the 235MB. To explain the additional traffic you need to show us (the GlassWire team and other users like myself) the usage statistics for the earlier date.
While you think that you can have the “same conditions” on your computer on different days, you cannot. The only way to reproduce the same conditions is to reset your computer back to the earlier state. Normally this is done by taking a backup copy of your system from that earlier date and then restoring that backup copy at the later date.