I am attempting to use Glasswire to monitor the amount of data used by my machine since we are stuck with Xfinity (Comcast) and have a data cap each month, and they have been claiming that we are exceeding it. Each day since the 19th the #1 contributor to usage according to the Usage tab is NT Kernel & System and it is showing usage over 300 GB, yet when I click on it, all it shows is 25 hosts, most of which are internal network addresses (192.X) and the IPV6 address. Can anyone explain what exactly this usage is, and how I can go about getting a more accurate snapshot of usage?
Usually to solve the issue, it’s important to look at what exactly the host is. There is a small three dot menu (…) next to the host. You can click it to learn more about it.
Again, the only thing that shows is our IPV6 address and it says that it is using 315.8 GB down and 826.3 mb up, 8 internal 192 addresses, the DNS server shows up twice, steampowered and epicgames shows up, but minimal usage on those. The number 1 contributor is the IPV6 address, can you explain that?
Are you doing file sharing or streaming between devices? Is it possible this is just local traffic we are showing that doesn’t cause any issues with your data cap?
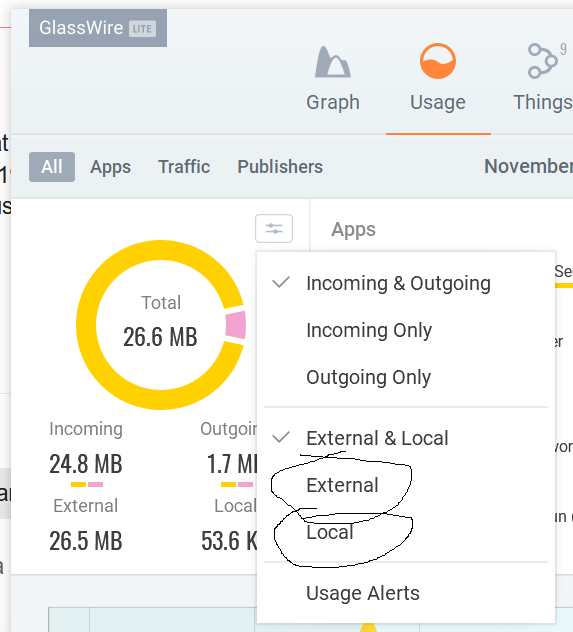
No file sharing or streaming, however, I did notice that it was showing all traffic, when I changed it to outgoing only, the numbers are much lower.
It’s some kind of activity between your devices on your local network, like software updates, or streaming, or file sharing.