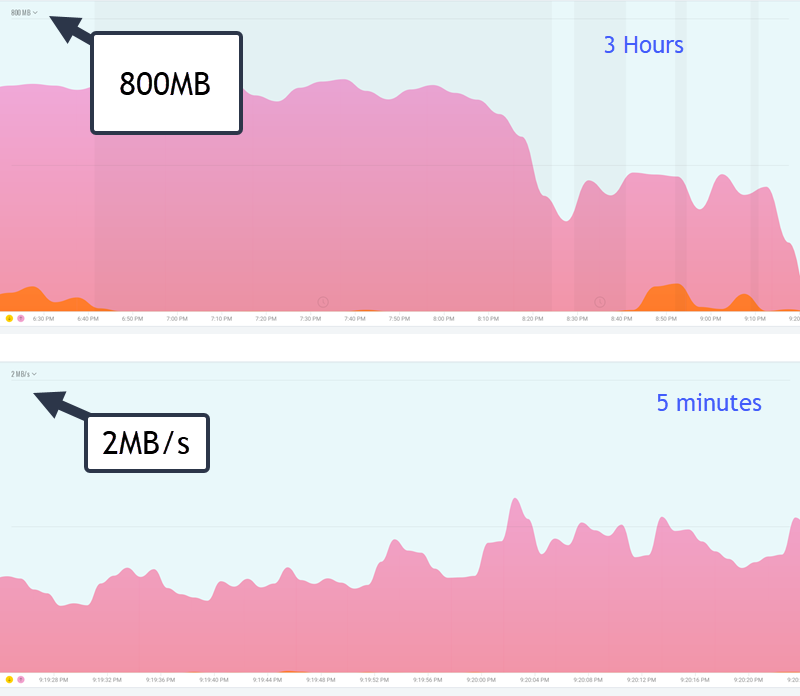
In the 5 minute graph, it’s clear the graph is displaying the current throughput per second. If the graph touches the 2 MB/s line, the throughput is 2 MB/s.
What does the 800MB line represent in the 3 Hour graph? 800MB over what period? Is it possible to set it to display throughput per second on all of the graphs?
Thanks for the reply. After reading the article, I’m still not sure what the 800MB in the first screen represents. Does it mean that if the graph were on that line for the entire 3 hours, 800MB would have been transferred during those 3 hours?
Also, is it possible to set Glasswire to display throughput per second on all graphs, regardless of the scale?
Thanks for your help.
Unfortunately we have no setting for this. Thanks for your feedback on improving the graph.