This is not a problem for me, but I’ve noticed that memory usage for the GlassWire Control Service is bouncing. It sometimes doubles for a short period and then drops back to the long run average.
Here’s an example. A couple of days ago, with less than a week of data, GCS was using 35MB. When I checked two hours ago it was 99MB but soon dropped back so one hour ago it was 57MB, and now it is 44MB.
Is there some sort of consolidation of data or compression being performed?
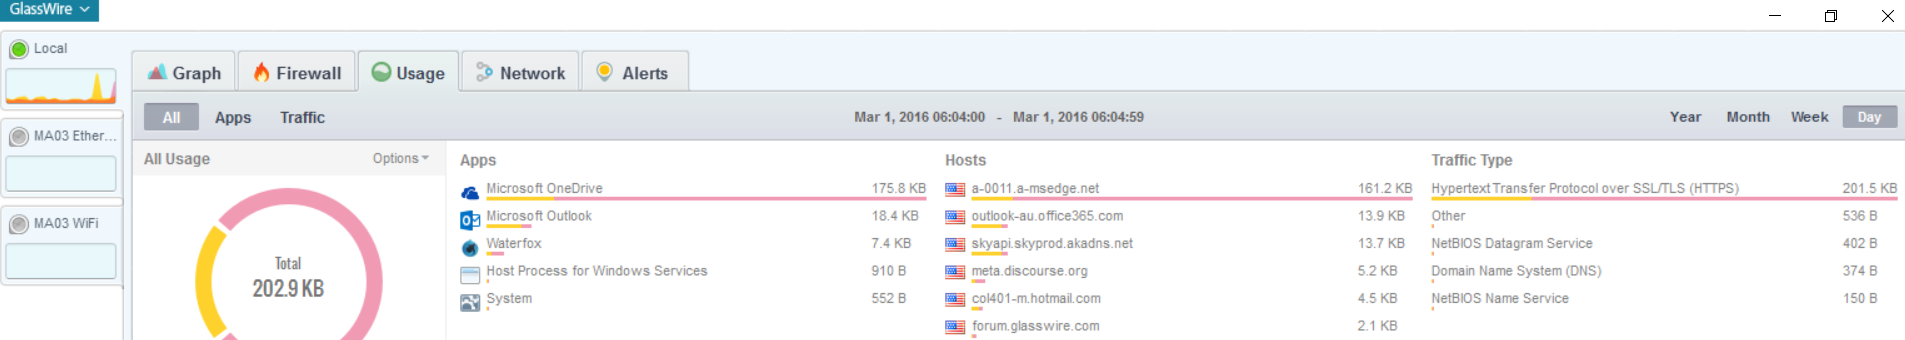
I think it all depends on how many hosts are involved with the network activity. If you have heavy network activity with heavy host usage then GlassWire will temporarily use more memory to graph it, then as that time passes the data will be saved in the database and your memory should decrease.
When you saw higher memory usage were you using Bittorrent?
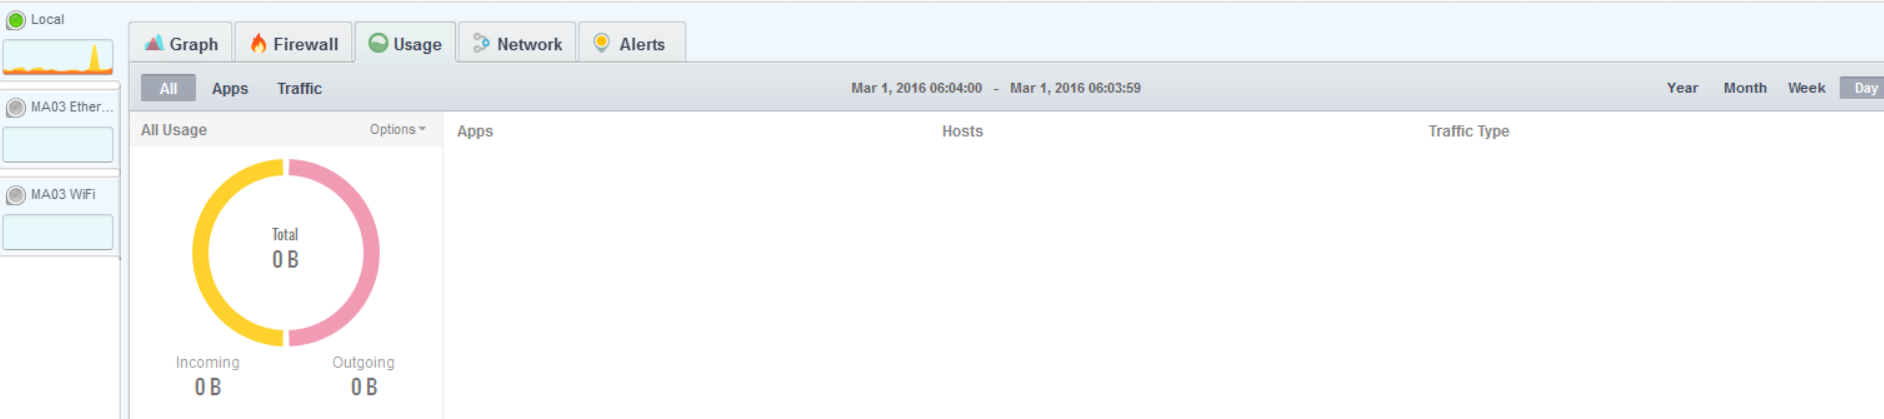
I have all the security settings turned on so I wondered if it is to do with “While you were away” because GlassWire is summarizing the network stats over most of a day?
I don’t think it has to do with “while you were away” but you can disable that feature in the settings to see. We actually made significantly more progress in limiting resource usage recently with the test versions so the next update should work much better for you.