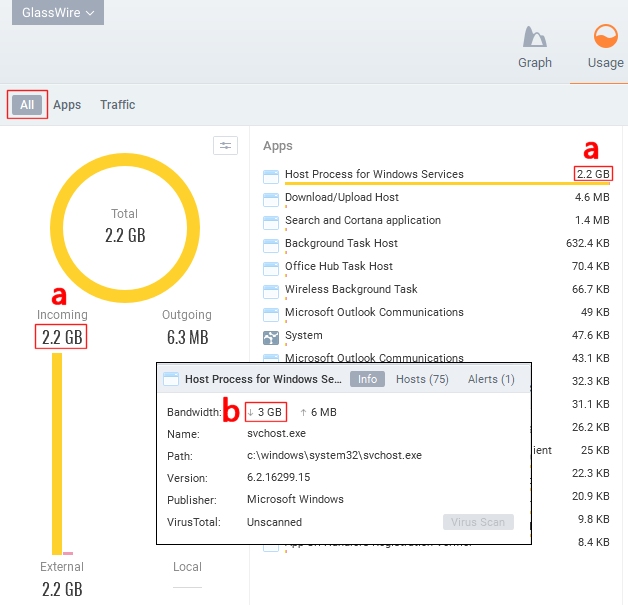
Whilst using GlassWire I noticed that whilst the overall incoming data volume showed as 2.2 GB (shown at a), when I clicked on Host Process for Windows Services it showed the incoming data volume as 3 GB (shown at b). Without adding up the individual amounts from each of the 75 Hosts, I have no idea which figure to rely on. Can you help?
Hello Rick, what are you trying to accomplish exactly? I want to be sure I give you correct info.
What’s your end goal? Do you want to know overall data, or just data for the svchost, and under what time period do you need for the data?
I’m just trying to work out how much traffic there is between a ‘clean installed’ Windows 10 FCU (1709) build and external connections, with a breakdown of traffic to/from each endpoint instead of an aggregate.
The time period would be over several days and the device would be sat there idle with nothing other than default OS services/processes running. I expect the first 24-hours to show a higher volume of traffic (as initial telemetry is uploaded and initial Windows updates and drivers are downloaded) to subsequent 24-hour periods when a more regular ‘Windows heartbeat’ may become evident.
I’m confused why the GlassWire GUI apparently shows an overall (aggregated) total of a 2.2 GB downloaded to 2 different locations (a) whilst (b) apparently shows a figure of 3 GB just for Host Process for Windows Services
It’s difficult to know for sure. Could it be some local traffic? If you go to the GlassWire’s “Usage” screen, are you viewing “External & Local”? You may want to switch the settings on “Usage” by clicking the small settings icon at the top right of the round graphic that shows your data usage on that screen.
Also Windows releases updates weekly usually, so if you are getting Windows updates you will get the amount of data usage that is required for that specific update, unless you disable Windows Updates for that time period.
We do have this Blog post about how GlassWire counts data traffic https://blog.glasswire.com/2016/06/15/glasswire-network-monitoring-accuracy/ and how you can test against our counting to check the accuracy.
I wish I knew why the host process for Windows is using so much traffic on that PC. Breaking the traffic down to local vs external might help solve the mystery, then check what hosts it’s communicating with.
Thanks for the reply. When I took the screenshot I had “Usage” set just to “External” connections, both “Incoming & Outgoing”.
The laptop was set up as follows:
-
Dell Latitude E7450 laptop. -
Win 10 Pro x64 - 1709 Fall Creators Update (Build 16299.15). -
OS clean installed, including making Cortana my personal assistant (not that I use it) and accepting the default privacy settings. -
Using a local account in the Administrators group. -
Not signed into any Microsoft Account for anything (OneDrive, Store, etc.). -
No security software other than Windows Defender. -
GlassWire v2.0.80 installer and O&O ShutUp10 (v1.6.1394, released November 08, 2017) copied over to it. I used a USB stick for the transfer so the laptop has no record of connecting to other devices on my home network or any browser use/download. -
Network discovery and file sharing have not been turned on, so it shouldn't go out looking for any other devices on the same network. -
All services have been left at their defaults. (I usually disable/amend loads of them.)
My plan was to use GlassWire to monitor 3 x 24-hour periods following the initial clean install of Windows 10 1709 then do another clean install of Windows 10 and install O&O ShutUp10 and GlassWire then monitor another 3 x 24-hour periods to a) check how much data Windows 10 uploads/downloads and b) see how effective O&O ShutUp10 is at curtailing telemetry and/or what Microsoft describe as ‘functional data’ uploads.
I had a look at the blog you mentioned but I’m afraid there was nothing in it about how I could test for accuracy… and it suggested using this forum to discuss ‘network statistic accuracy’. I’m a bit stuck now… but thanks anyway.
1 Like
For your experiment I recommend:
-
Only checking external data.
-
Disabling Windows Update.
Then check GlassWire’s “Usage” screen for both options (with telemetry blocked, and without) and see the differences.
By the way, you can block Telemetry with the OS https://blog.glasswire.com/2015/09/15/165/ so a third party tool may not be necessary to test the differences, depending on your OS version.
As per my previous post, I WAS only checking external data.
I also mentioned that the purpose of my experiment was to “check how much data Windows 10 uploads/downloads”… yet you’ve advised me to disable Windows Update, i.e. one of the primary services that I’m trying to monitor.
Sorry but it doesn’t seem like I’m going to get an answer (or resolution) to my original question about the discrepancy in incoming data volume shown in different areas of the GlassWire GUI. Please just mark this thread as closed. Many thanks.
Sorry for any confusion. I thought if you didn’t disable Windows Update it would give incorrect info, since Microsoft usually does a Windows security update every week and those update sizes can vary greatly.
For the discrepancy, I apologize for missing that before. It was in the title so I should have noticed.
Did you use GlassWire 1.0 before upgrading to 2.0, or is GlassWire 2.0 the first time you have used our software? It will help me answer the question about the discrepancy.
@RickC, is you picture single screenshot or two combined (main window screenshot + info popup cut from another screenshot)?
It’s 2 screenshots combined. I superimposed the info popup over the main window so I could show the comparison better than I could describe them.
Then are you sure you had same options (local/extern traffic switch) in both cases?
And one more question, if you restart the GlassWire application (click exit in tray menu and run again), do you see the same problem?
Yes, I’m positive. The two screenshots were taken less than a minute apart when I realised the discrepancy. No configuration changes were made between the screenshots.
Too much time has passed for me to just restart the application and run again. I would have to do a clean install of Windows 10 from scratch again because it’s now downloaded all its updates (including this week’s) and settled into a more regular ‘Windows heartbeat’ of minimal downloads/uploads.
I mean, did you see this problem only once, or maybe multiple times (in different application runs)? I’m pretty sure it’s a bug, just want understand possible conditions. Thanks.
Twice. I thought I had done something wrong when I first noticed it so clean-installed Win 10 again… same result, i.e. a discrepancy between the info popup and main window. I took the screenshots the second time round. I haven’t clean-installed since.
So, you’ve installed clean Win 10, right after installed Glasswire and wait some time to gather stats and get above problem - ok, I’ll try to repeat. Thank you!
Have a look at post #5 above. It lists how I went about the setup. I’m going to clean install Windows 10 again and carry out the exact same process again.
I hadn’t realised that GlassWire counts 24-hour periods based on ‘midnight to midnight’ each calendar day (rather than ‘per each 24 hour period from the time it’s first run’ so I’ll be prepping the laptop later today to start recording from midnight onwards. I should have some measurable results by approx. 1 a.m.
1 Like
All set up. Laptop now clean-installed again with Windows 10 1709 (from the same USB stick created by MS’ Media Creation Tool as before) using the same settings as before (see post #5).
There IS a difference but should (hopefully) have no effect on results. This time I have also copied over 2 portable tools - ScreenshotCaptor 4.16.1.10 and ScreenToGif 2.2 - to the same test laptop.
ScreenshotCaptor is so I can capture screenshots without any delay caused by using MS’s Paint app that I used in previous test. ScreenToGif is so I can record moving from GlassWire’s main window to any info popup. I’ve run both so I can configure them and have deleted my test captures.
I’ve exited ScreenToGif but ScreenCaptor is still running, ready to capture screenshots of the full desktop whenever I press the laptop’s PrtScr button. I’ve set it to capture full-screen screenshots and save them immediately to the %user% desktop without displaying them (so there is as little delay as possible between subsequent screenshots).
I have an alarm set for midnight. When it sounds I will run GlassWire for the first time (on this particular Win 10 install) and, at the same time, attach an ethernet cable to the test laptop for its network (hence internet) connection, i.e. same as before.
Let me know if there’s something I haven’t thought of.
Hope this helps…
1 Like
Hmm… the disrepancy has happened again… and I have many screenshots to demonstrate it (plus a GIF tracking my actions),
TL:DR: Main screen shows a different data representation to the data displayed in the aforementioned info popup.
IMO, the difference between Bandwidth (i.e possible maximum) and Throughput (i.e. actual result) is neither shown nor explained well.
This has been interesting and informative. However, it’s time for me to knock my musings into touch.
Thank you for your help. I wish all the best for you.