Great Product. Can you provide an option to fix the vertical scale (download by KB or MB). This will immediately provide a look into large or small downloads. (Unless I am missing something). THANKS.
We have had other users request a feature to pause scaling and we’re looking at options to do so in the future. The problem with pausing scaling though is that the graph will go completely off the graph in some cases, so I’m not sure it would be a good user experience for most people.
A better option might be to switch to weekly or monthly usage which scales everything back automatically, but the graph will move very slowly.
Thanks Ken, I appreciate that “risk” but if the scaled axis is offered as a separate option, then people would know what it does. I used NETWORX until I found GW and it had that. Often the graph would go out of the box but that was something I wanted to know about. Adjusting the scale to fit that surge would rob me of the information.
Thanks all the same
2 Likes
What a great little program I’ve just found here with GlassWire. Like above I was about to switch from Networx but there’s one major flaw as far as I’m concerned and I’m surprised to read on this forum of others asking the same thing about the confusing graph auto-scaling for at least the last two or three years.
I really do not want the scale jumping up and down to fill the program’s window height, it puts everything out of context and I can’t imagine it helping anyone. I need to see how things are performing at a glance and I need to fix the vertical scale according to units I decide and require.
I noticed a stock answer to this question/problem a couple of times which quite frankly doesn’t really justify things, it is:
“Do you mean you want to change the scaling? GlassWire automatically scales and shows the most appropriate size for your current network usage, otherwise the graph would be too large or too small to be useful.”
No, that is totally the wrong attitude and way to think. If I set my vertical scale to my needs, say 80Mbps, then if I have a low Mbps rate showing then I need it to show exactly that way down the bottom of the graph. It’s the only way things can make sense and be properly represented and I just cannot understand why this is not possible.
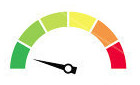
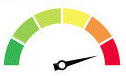
As things stand, it’s like having a car speedometer that always re-scales it’s reading to somewhere near the maximum mark but changes the speed units. It (and life) just doesn’t work like that and it tells me nothing. I need it to show low when it’s low and high when it’s high. Stop moving the goalposts, let me fix them in place. I need to alter and fix the scale (and the units used) - at least give me the option to decide for myself between your way and mine.
Sorry, but unless I’ve missed a setting somewhere, I’m flabbergasted that a fixed scale view is not possible and I’ll have to give GW a miss. It can do everything I was looking for except show it. (Oh, and a small/minimal summary tracker view window would be handy too).
3 Likes
Thanks for your feedback. We’re investigating different types of graphs for the future.
1 Like
Friends: I wrote you in Jan 16 about this feature. Today in March 2017 is the “future” of Jan 2016.
Come on, how long does it take to put a little option to fix the scale?
I am using DU Meter now (after Networx) and they have it. Other products have it.
Why be unique in not having it?
Please do not wait for the future.
Thanks
1 Like
I agree 100+%. Variable scales is not just a preference. It either makes the program usable or not usable as far as I’m concerned. Seems many feel the same way despite what the developers think we should want.
2 Likes
HI Ken
I do not agree that most people would find the graph going off the display area. When i started using such products, at the time of frequent upgrade of bandwidth, I had to frequently change the max limit. It was quite easy. Most of my friends who monitor their bandwidth get happy when the graph goes off the area: speed!! HAHA. So please, we are giving you evidence of need.
1 Like
I haven’t been using Glasswire in all this time since I discovered it in March 2017 due to this major limitation, but today thought I’d have another look to see if fixed vertical scaling is finally in there yet?
I’m rather stunned that it isn’t and I can’t believe you don’t find it important - how on earth can a graph scale that jumps all over the place show anything meaningful?
Like I said before, it’s like having a car speedometer that constantly shows max but changes the units - I cannot see how anybody finds this useful and it provides no context in its use and as far as I can see unnecessarily causes the eye to have to keep examining the graph, scale and readings when things (pointlessly) jump around.
The requests to have this ability date back over three years.
What is the reasoning for not allowing a fixed vertical scale?
4 Likes
It does seem odd that fixing the scale of the graph is not an option, at least.
A fixed scale would be very useful to me, as I’m using an ADSL connection which has fixed upper limits for upload and download speeds, and being able to see how my data transfer is in relation to those limits is the most interesting thing I’d like to see.
3 Likes
Exactly.
Currently, the way GlassWire represents things makes absolutely no sense at all to me, nothing is in context and thus pointless. GW’s graphs are principally visual tools, but any use of that visual ability is rendered useless because one is further required to analyse its graphs before its readouts begin to make sense.
It’s like having two minimum-maximum dials, one showing a low reading and the other on maximum, but both dials representing the same low value.
Or like having a time clock that shows the hands anywhere it likes for any known time of the day. An analogue clock works because one can just glance at the hands and know the time - there is no comparison or calculation work involved. The same does not apply for GW.
I completely uninstalled GW the other day because I find it pointless and never look at or open it yet it was always running as a service recording its data. I was hoping they’d add the long requested feature but it looks unlikely and ignored without valid reason or further response.
2 Likes
Thanks for your feedback. We will investigate adding more scaling options in the future.
2 Likes
With respect, you’ve been saying that for over three years, see this other request:
And you only say you’ll investigate it for the future - hence my giving up, uninstalling and unsubscribing.
Essentially, if you haven’t investigated and realised the importance and need for it to scale proportionately by now, I doubt you ever will.
My current use of Networx does exactly what I need in that respect:
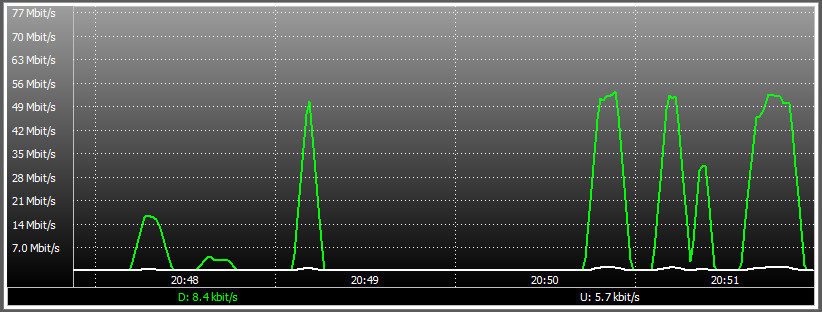
With Networx I can see out of the corner of my eye, without thinking, exactly what’s going on with the network traffic. Whatever other benefits and tricks GW can do I will never know (and to date haven’t really needed) because I really do not want to see the minutiae of traffic showing as huge jumping spikes all over the place on my screens, all of which would in effect be worrying false-positives.
2 Likes
I don’t recall seeing an email about surveys and I do review all emails, all I get is like a weekly summary of things which I vaguely glance at. As for regularly visiting the forum, well there are too many things like that in life to keep up with so rarely happens.
My problem though with what you say is that you don’t recognise the need for it yourselves and are just relying on surveys (or rather than this forum?!). Maybe surveys don’t always work? (it didn’t for me, I didn’t even know there was one). Or maybe people answering surveys didn’t think of it as an option and just accept that’s how GW is (and seemingly will never change judging by responses so far), or depending on the survey type and how it’s written maybe there wasn’t a suitable question, or maybe anyone wanting fixed scales gave up on GW ages ago (which in effect I did) and therefore wouldn’t be around to answer your survey?
I think my analogies with clocks, speedometers, and min-max gauges adequately illustrate the importance of a fixed-scale need, even on just a usability/visual quick-reference level.
Imagine how hard things would be if the hands of my on-screen clock or the red circle on my calendar never changed position, but the numbers did:
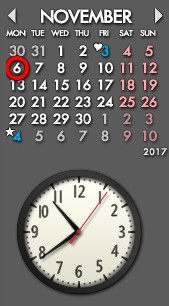
It would make life much harder, but I guess one could at least say that twice a day for the clock, or once a month for the calendar, one, other or both would at some point be visually correct and in context within defined norms - that’s what GW’s ever-changing graph does to me and I’m amazed more don’t find the same and that you haven’t just allowed a fixed scale as an interface option from day one.
1 Like
Just a comment to say that the lack of fixed scale options is the main reason I can’t justify paying for GlassWire.
3 Likes
Probably never going to happen. I check back occasionally and GW has been uninstalled (and paid for) since I brought this up, um, one, maybe two years ago.
2 Likes
Similarly, looking back here to see if the much needed fixed scaling is implemented yet?
Setting up a new computer and would like a bandwidth monitor but one that would be visually useful (for all the obvious reasons) - did GW add the option yet?
Would gladly buy if they have but can’t find any info on it, so I assume not!
1 Like
I’m glad that @zeker and @MrArtist keep bringing this up.
@Ken_GlassWire, this must be the most requested feature that has not been implemented. If you search for “fixed scale”, you can see how popular it is.
I don’t need this feature most of the time but it should be a implemented so I can use it when I need it.
3 Likes
Thanks @Remah
I don’t get why it’s such a problem, even on short timeframes?
All I need is to see is a graph that doesn’t bounce all over the place changing the units but not the max-peaks level. Is it really that hard to do?
Like I said above a few times above over the last year or two, as things stand with GW, it’s like having a car speedometer showing roughly near maximum all the time but only changing the units, or having an analogue clock with the hands roughly in one position but changing the numbers accordingly - I just don’t understand the logic or why most people seem happy with the way it is?!!
I can understand GW’s current method helps show the small details of what’s happening, but as an overall performance indicator, available at a glance, GW fails miserably and I can’t put things into context at all.
Someone please tell me why my view/need of the world is not more widely understood?
Right now, with setting up my new computer, all I want to do is see how my downloads are performing while various large downloads and cloud services do their tasks and to get an overall view of how quickly things are going in relation to how fast things potentially can be on the network I’m currently on - with GW, it so hard to do or see consistently.
Whilst the first claim of GW is “Visual Network Monitoring” in its website “Features Section”, it’s so hard to actually achieve in a consistent way - it’s ironic and defies logic!
2 Likes