I tried two other network monitoring options without GlassWire and repeated the GlassWire running and not running scenarios as higher throughput is being achieved:
- GlassWire disabled and Windows Resource Monitor running
 738/101
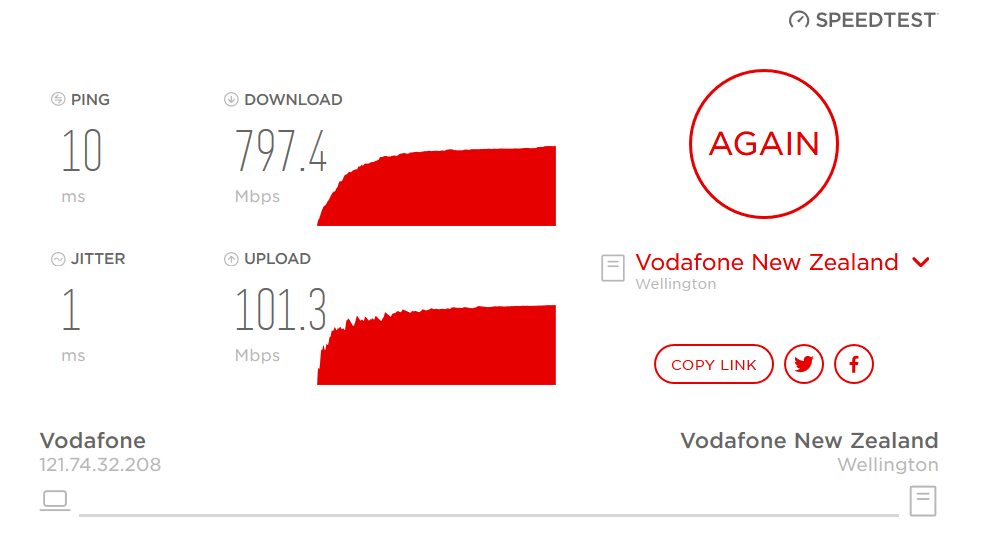
- GlassWire disabled and Windows Message Analyzer running
797/101
- GlassWire disabled
735/100
- GlassWire enabled
607/100
The only scenario that clearly slows throughput is when GlassWire is running.
Apologies for the long post. 
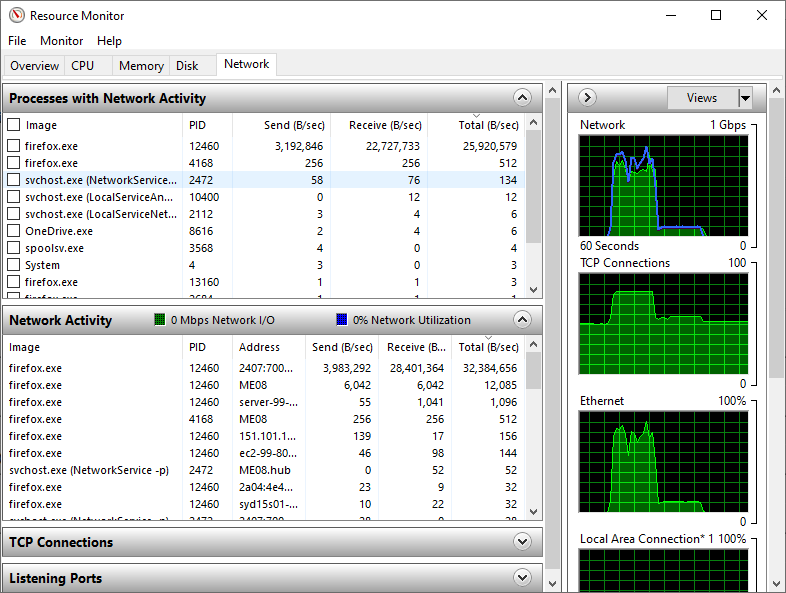
Scenario 1 - Speed test with GlassWire disabled and Windows Resource Monitor running
Speed test
Higher throughput, maybe because lots of parents have got off their computers and gone to get their kids from school!?
Windows Resource Monitor running
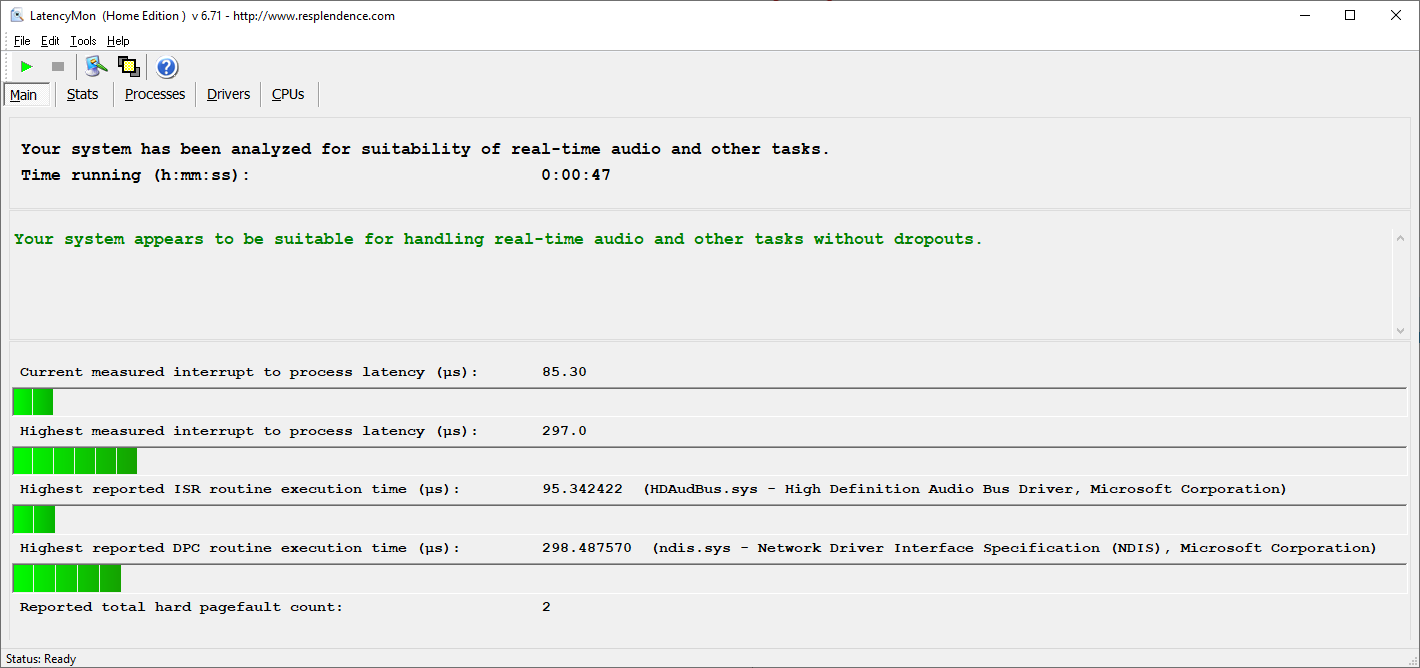
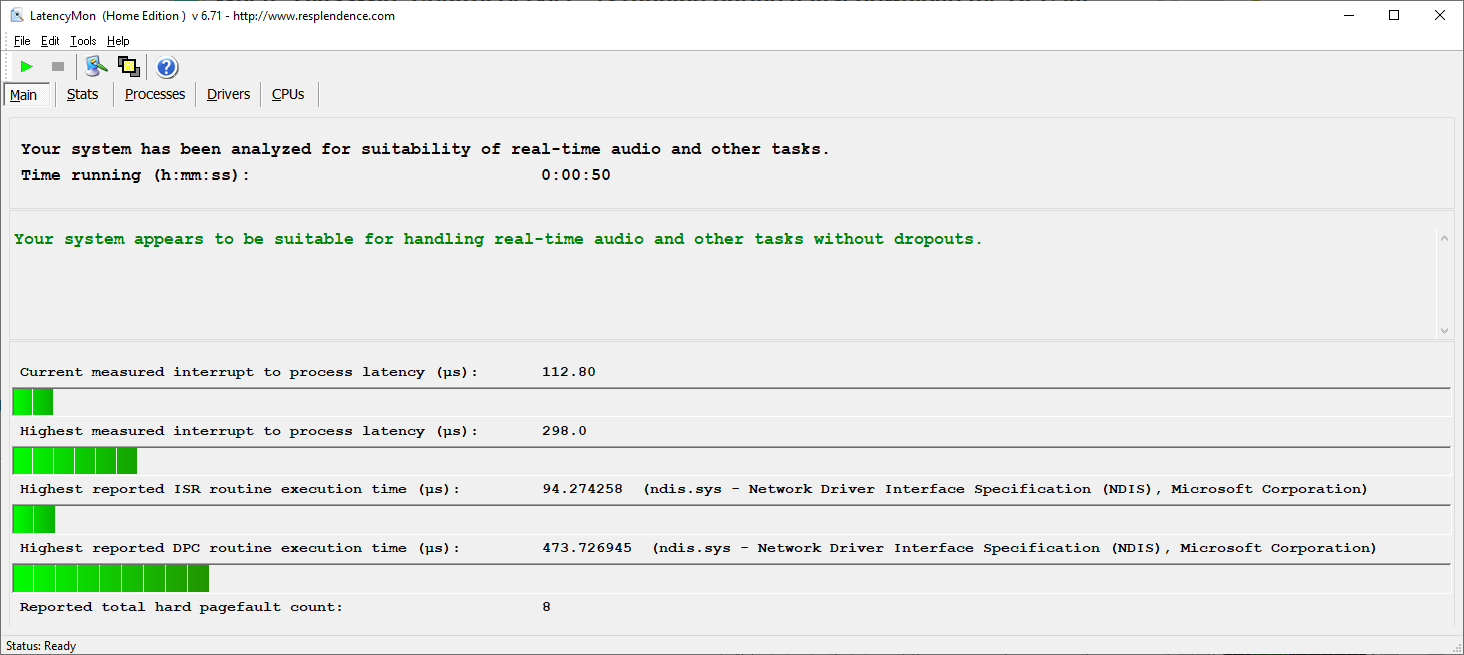
LatencyMon
Text report
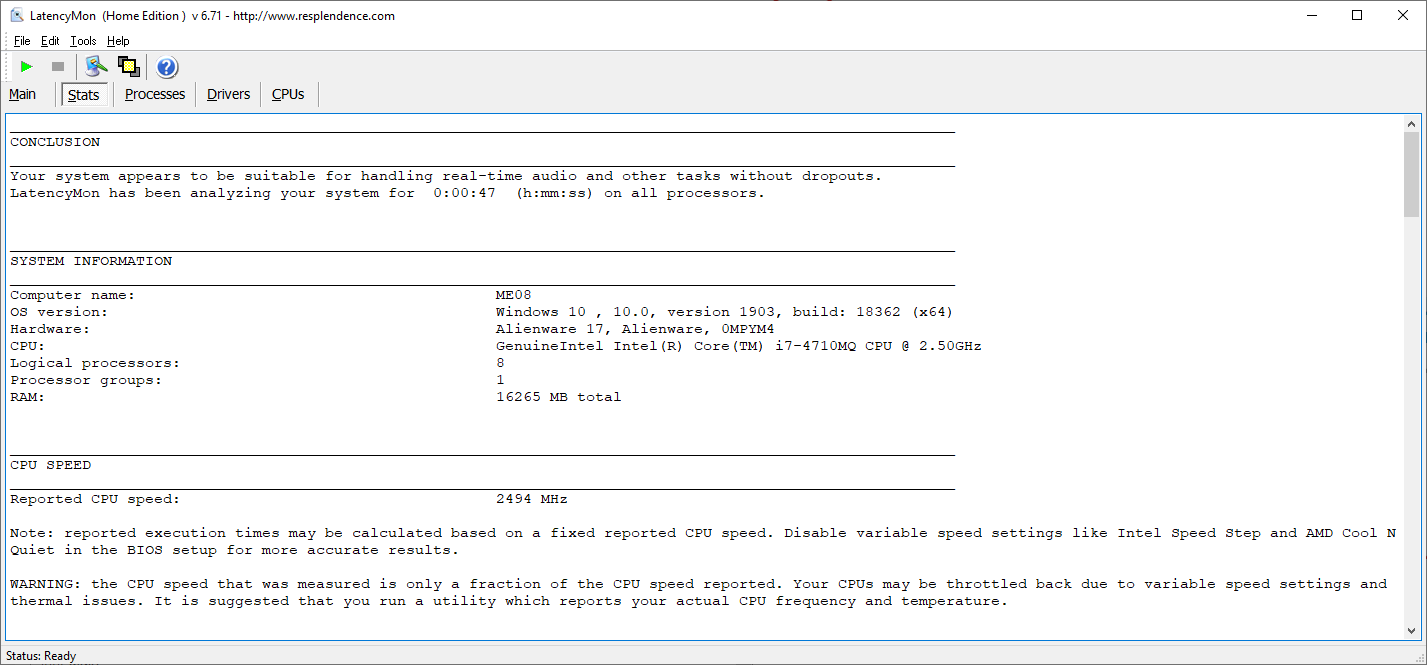
CONCLUSION
Your system appears to be suitable for handling real-time audio and other tasks without dropouts.
LatencyMon has been analyzing your system for 0:00:50 (h:mm:ss) on all processors.
SYSTEM INFORMATION
Computer name: ME08
OS version: Windows 10 , 10.0, version 1903, build: 18362 (x64)
Hardware: Alienware 17, Alienware, 0MPYM4
CPU: GenuineIntel Intel® Core™ i7-4710MQ CPU @ 2.50GHz
Logical processors: 8
Processor groups: 1
RAM: 16265 MB total
CPU SPEED
Reported CPU speed: 2494 MHz
Note: reported execution times may be calculated based on a fixed reported CPU speed. Disable variable speed settings like Intel Speed Step and AMD Cool N Quiet in the BIOS setup for more accurate results.
WARNING: the CPU speed that was measured is only a fraction of the CPU speed reported. Your CPUs may be throttled back due to variable speed settings and thermal issues. It is suggested that you run a utility which reports your actual CPU frequency and temperature.
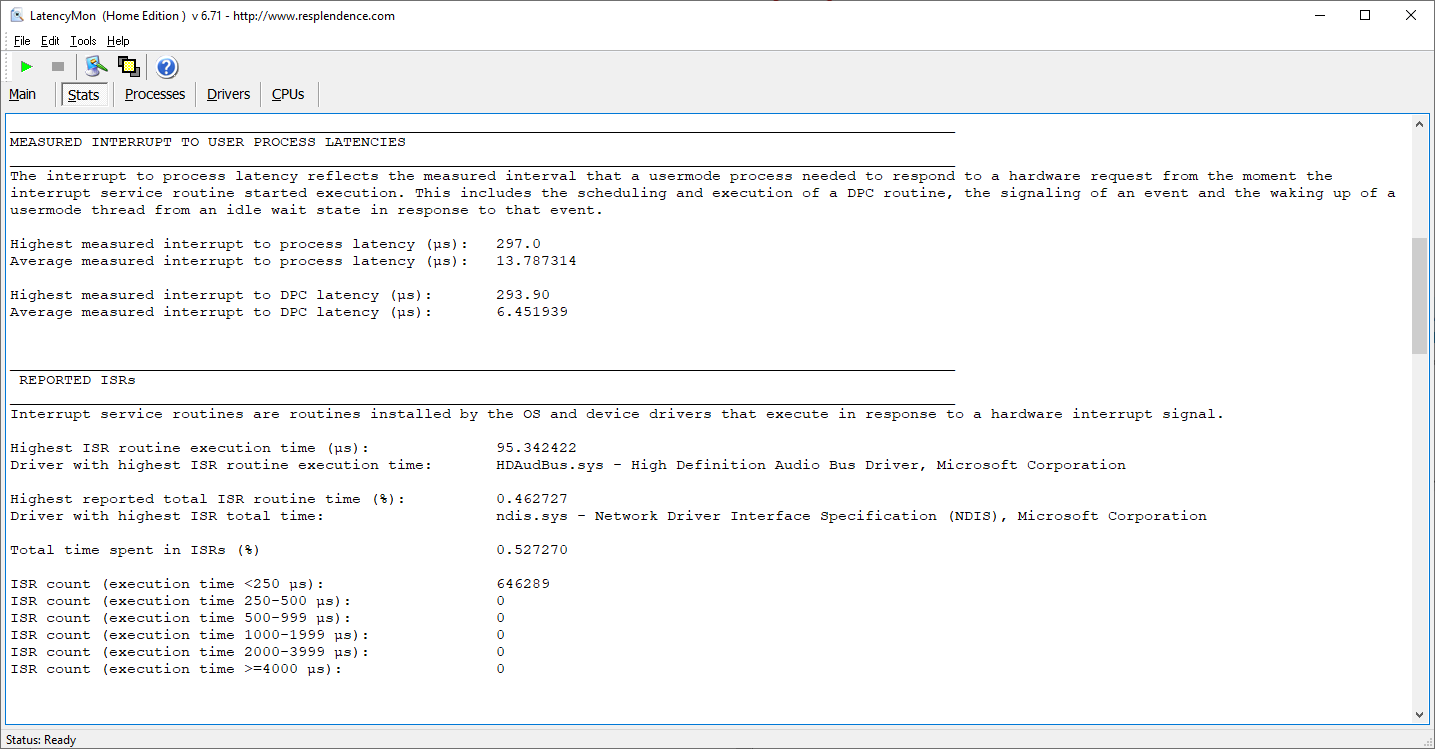
MEASURED INTERRUPT TO USER PROCESS LATENCIES
The interrupt to process latency reflects the measured interval that a usermode process needed to respond to a hardware request from the moment the interrupt service routine started execution. This includes the scheduling and execution of a DPC routine, the signaling of an event and the waking up of a usermode thread from an idle wait state in response to that event.
Highest measured interrupt to process latency (µs): 298.0
Average measured interrupt to process latency (µs): 18.499961
Highest measured interrupt to DPC latency (µs): 273.60
Average measured interrupt to DPC latency (µs): 9.510706
REPORTED ISRs
Interrupt service routines are routines installed by the OS and device drivers that execute in response to a hardware interrupt signal.
Highest ISR routine execution time (µs): 94.274258
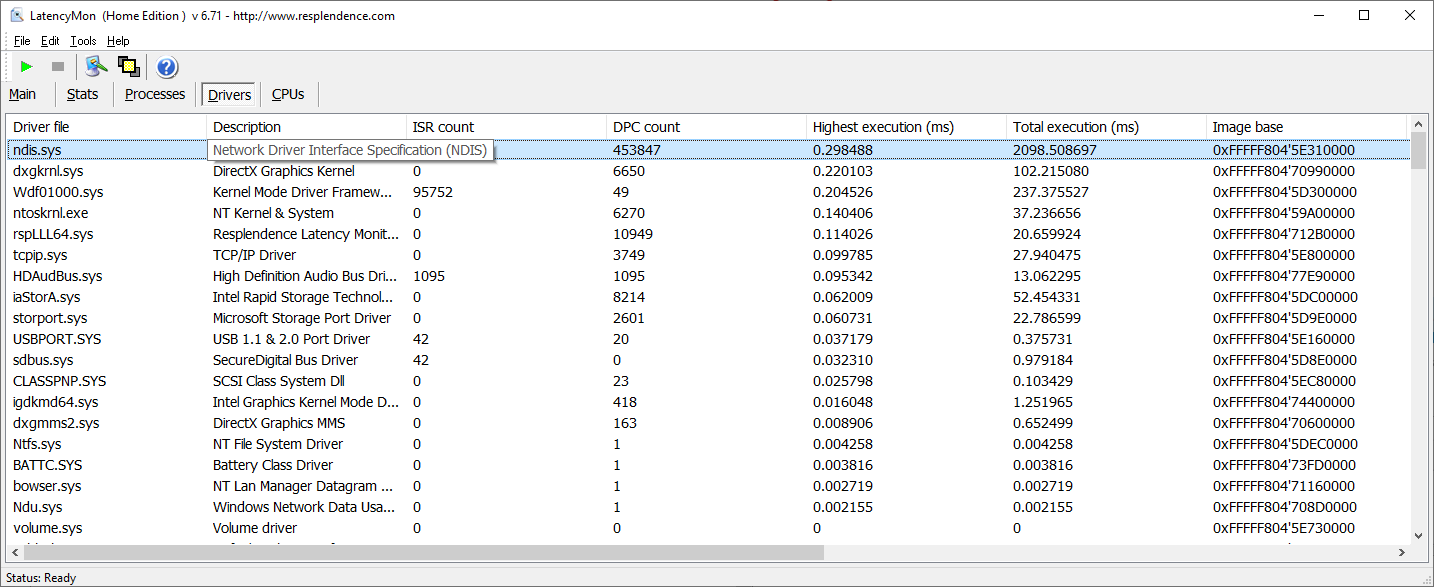
Driver with highest ISR routine execution time: ndis.sys - Network Driver Interface Specification (NDIS), Microsoft Corporation
Highest reported total ISR routine time (%): 0.451270
Driver with highest ISR total time: ndis.sys - Network Driver Interface Specification (NDIS), Microsoft Corporation
Total time spent in ISRs (%) 0.484532
ISR count (execution time <250 µs): 529091
ISR count (execution time 250-500 µs): 0
ISR count (execution time 500-999 µs): 0
ISR count (execution time 1000-1999 µs): 0
ISR count (execution time 2000-3999 µs): 0
ISR count (execution time >=4000 µs): 0
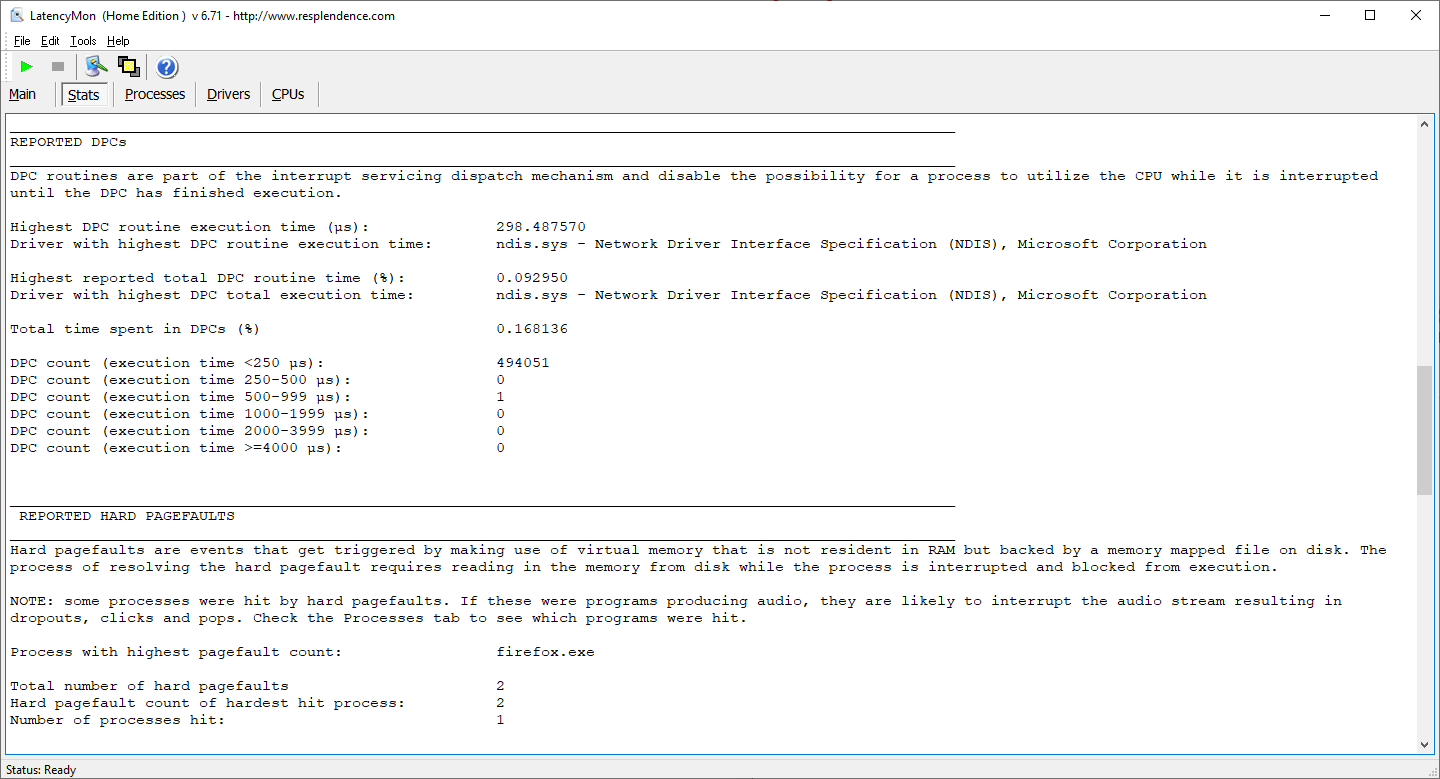
REPORTED DPCs
DPC routines are part of the interrupt servicing dispatch mechanism and disable the possibility for a process to utilize the CPU while it is interrupted until the DPC has finished execution.
Highest DPC routine execution time (µs): 473.726945
Driver with highest DPC routine execution time: ndis.sys - Network Driver Interface Specification (NDIS), Microsoft Corporation
Highest reported total DPC routine time (%): 2.498758
Driver with highest DPC total execution time: ndis.sys - Network Driver Interface Specification (NDIS), Microsoft Corporation
Total time spent in DPCs (%) 2.567489
DPC count (execution time <250 µs): 473790
DPC count (execution time 250-500 µs): 0
DPC count (execution time 500-999 µs): 22
DPC count (execution time 1000-1999 µs): 0
DPC count (execution time 2000-3999 µs): 0
DPC count (execution time >=4000 µs): 0
REPORTED HARD PAGEFAULTS
Hard pagefaults are events that get triggered by making use of virtual memory that is not resident in RAM but backed by a memory mapped file on disk. The process of resolving the hard pagefault requires reading in the memory from disk while the process is interrupted and blocked from execution.
NOTE: some processes were hit by hard pagefaults. If these were programs producing audio, they are likely to interrupt the audio stream resulting in dropouts, clicks and pops. Check the Processes tab to see which programs were hit.
Process with highest pagefault count: firefox.exe
Total number of hard pagefaults 8
Hard pagefault count of hardest hit process: 8
Number of processes hit: 1
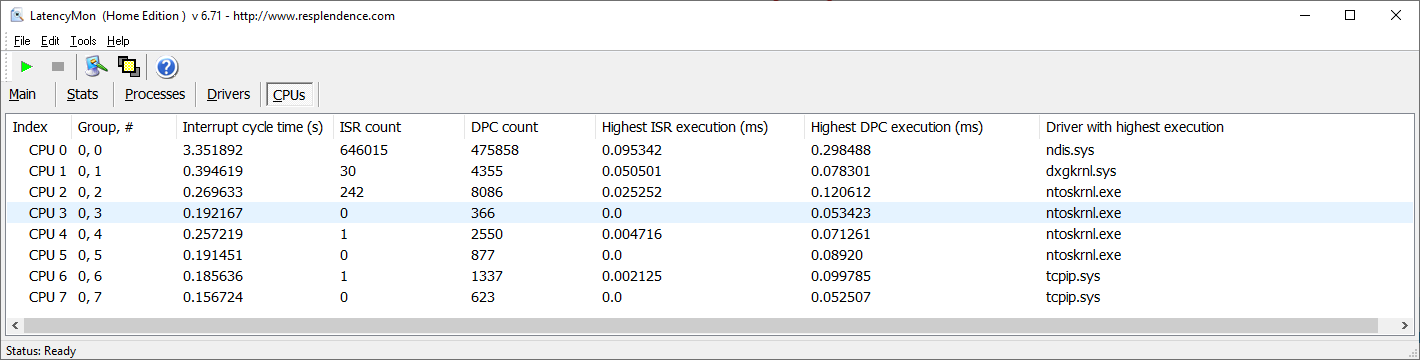
PER CPU DATA
CPU 0 Interrupt cycle time (s): 13.256916
CPU 0 ISR highest execution time (µs): 87.053729
CPU 0 ISR total execution time (s): 1.935567
CPU 0 ISR count: 528699
CPU 0 DPC highest execution time (µs): 473.726945
CPU 0 DPC total execution time (s): 10.162841
CPU 0 DPC count: 459548
CPU 1 Interrupt cycle time (s): 0.464824
CPU 1 ISR highest execution time (µs): 14.535686
CPU 1 ISR total execution time (s): 0.000033
CPU 1 ISR count: 6
CPU 1 DPC highest execution time (µs): 215.061748
CPU 1 DPC total execution time (s): 0.036412
CPU 1 DPC count: 3134
CPU 2 Interrupt cycle time (s): 0.296266
CPU 2 ISR highest execution time (µs): 94.274258
CPU 2 ISR total execution time (s): 0.003011
CPU 2 ISR count: 199
CPU 2 DPC highest execution time (µs): 167.391740
CPU 2 DPC total execution time (s): 0.036337
CPU 2 DPC count: 5096
CPU 3 Interrupt cycle time (s): 0.333218
CPU 3 ISR highest execution time (µs): 51.784282
CPU 3 ISR total execution time (s): 0.001322
CPU 3 ISR count: 180
CPU 3 DPC highest execution time (µs): 110.810746
CPU 3 DPC total execution time (s): 0.006164
CPU 3 DPC count: 973
CPU 4 Interrupt cycle time (s): 0.244039
CPU 4 ISR highest execution time (µs): 3.528468
CPU 4 ISR total execution time (s): 0.000004
CPU 4 ISR count: 1
CPU 4 DPC highest execution time (µs): 90.807137
CPU 4 DPC total execution time (s): 0.01470
CPU 4 DPC count: 2046
CPU 5 Interrupt cycle time (s): 0.180139
CPU 5 ISR highest execution time (µs): 0.0
CPU 5 ISR total execution time (s): 0.0
CPU 5 ISR count: 0
CPU 5 DPC highest execution time (µs): 68.181636
CPU 5 DPC total execution time (s): 0.004782
CPU 5 DPC count: 604
CPU 6 Interrupt cycle time (s): 0.222445
CPU 6 ISR highest execution time (µs): 4.977145
CPU 6 ISR total execution time (s): 0.000012
CPU 6 ISR count: 6
CPU 6 DPC highest execution time (µs): 92.115878
CPU 6 DPC total execution time (s): 0.012226
CPU 6 DPC count: 1589
CPU 7 Interrupt cycle time (s): 0.183152
CPU 7 ISR highest execution time (µs): 0.0
CPU 7 ISR total execution time (s): 0.0
CPU 7 ISR count: 0
CPU 7 DPC highest execution time (µs): 68.854050
CPU 7 DPC total execution time (s): 0.006148
CPU 7 DPC count: 822
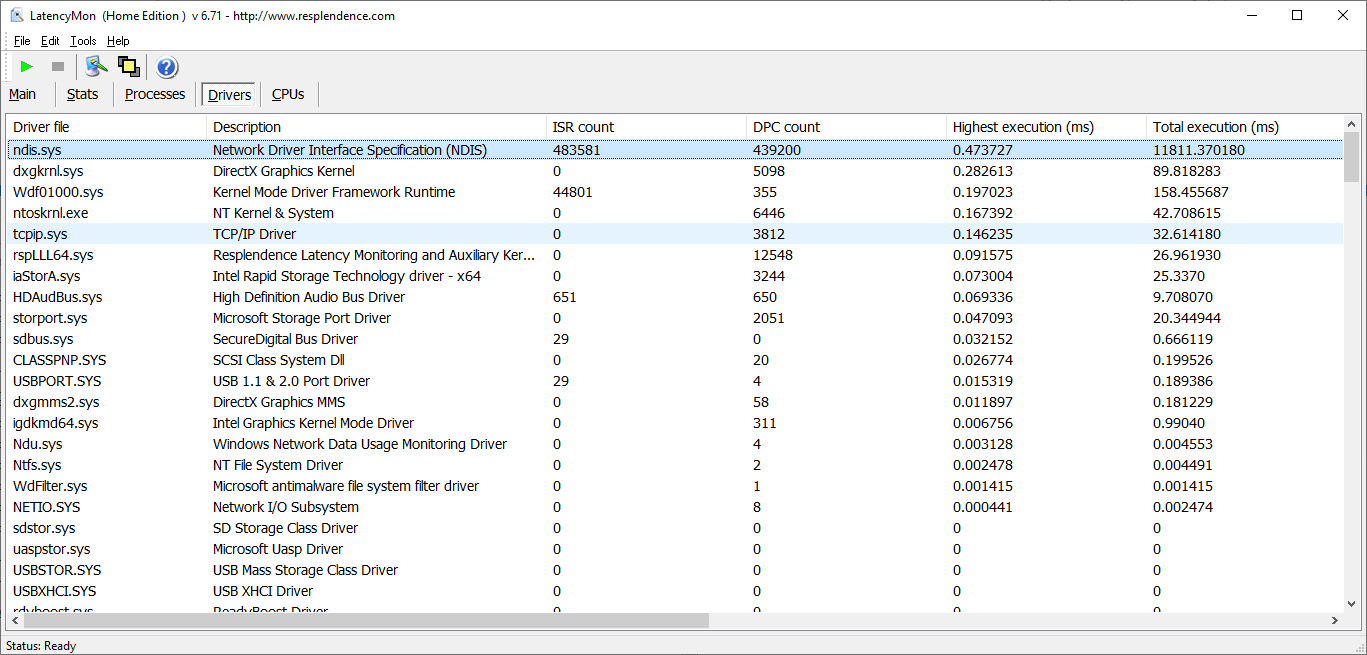
Drivers
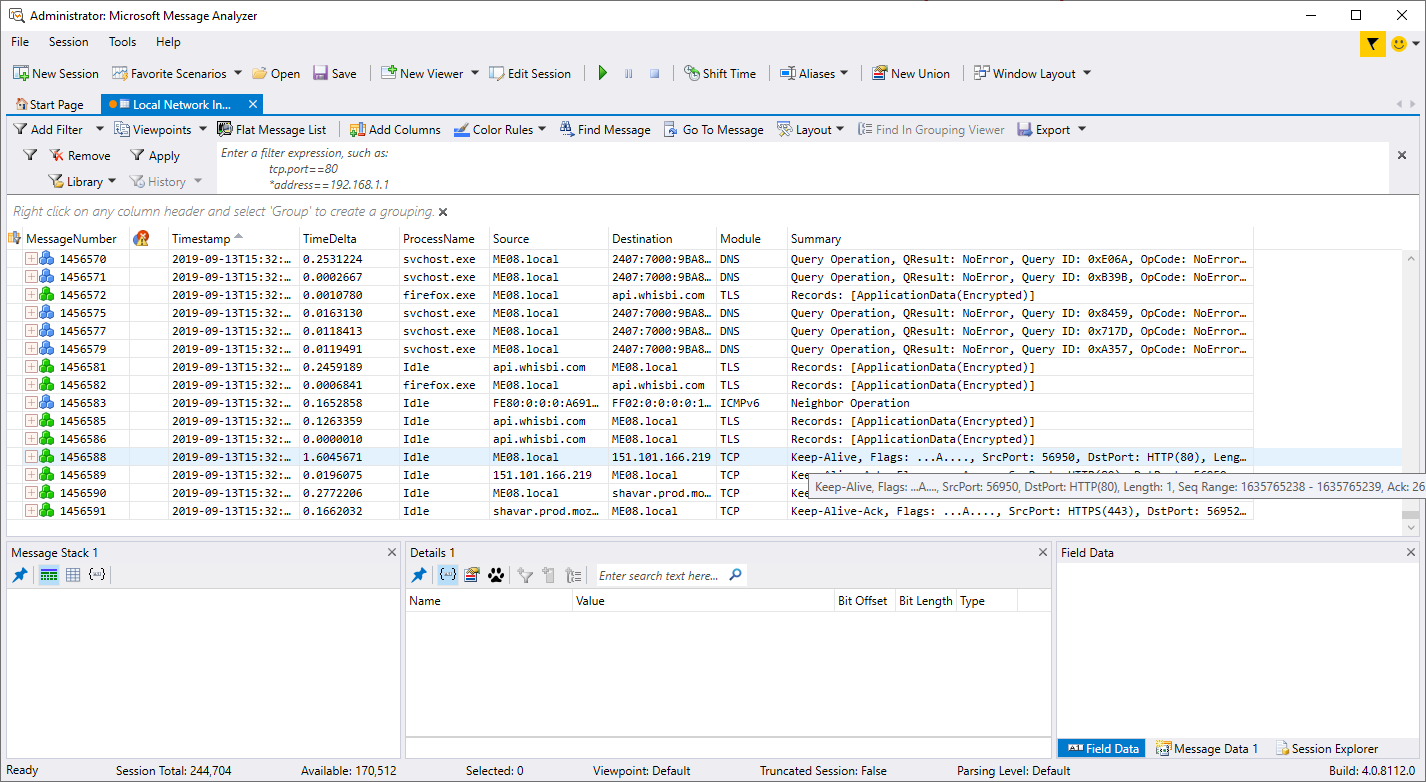
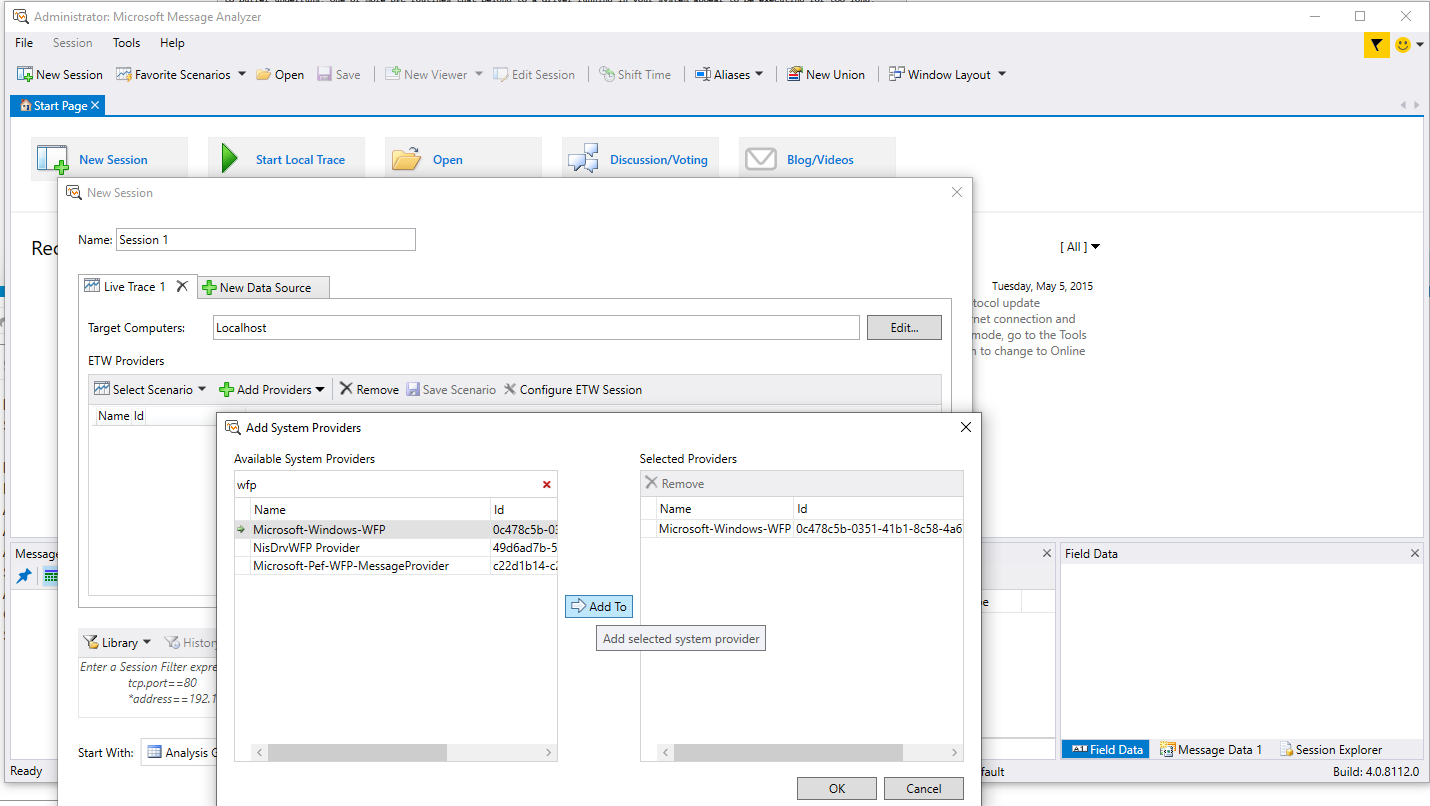
Scenario 2 - Speed test with GlassWire disabled and Windows Message Analyzer running
Installed 64-bit version 1.4 build 4.0.8112.0
No optimization for data capture.
Run as administrator.
Select File | Favorite scenarios | Local network interfaces
Windows Message Analyzer
Speed test
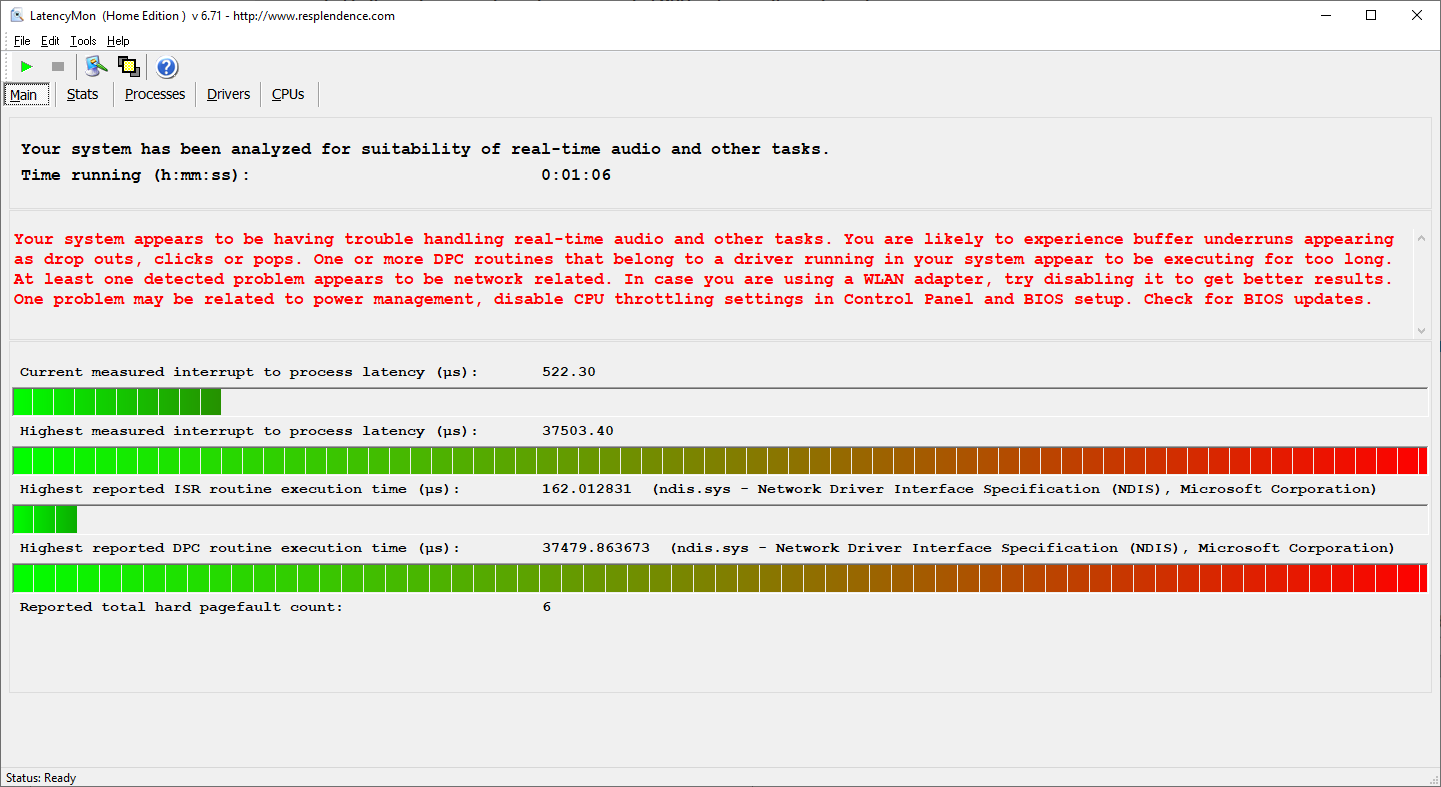
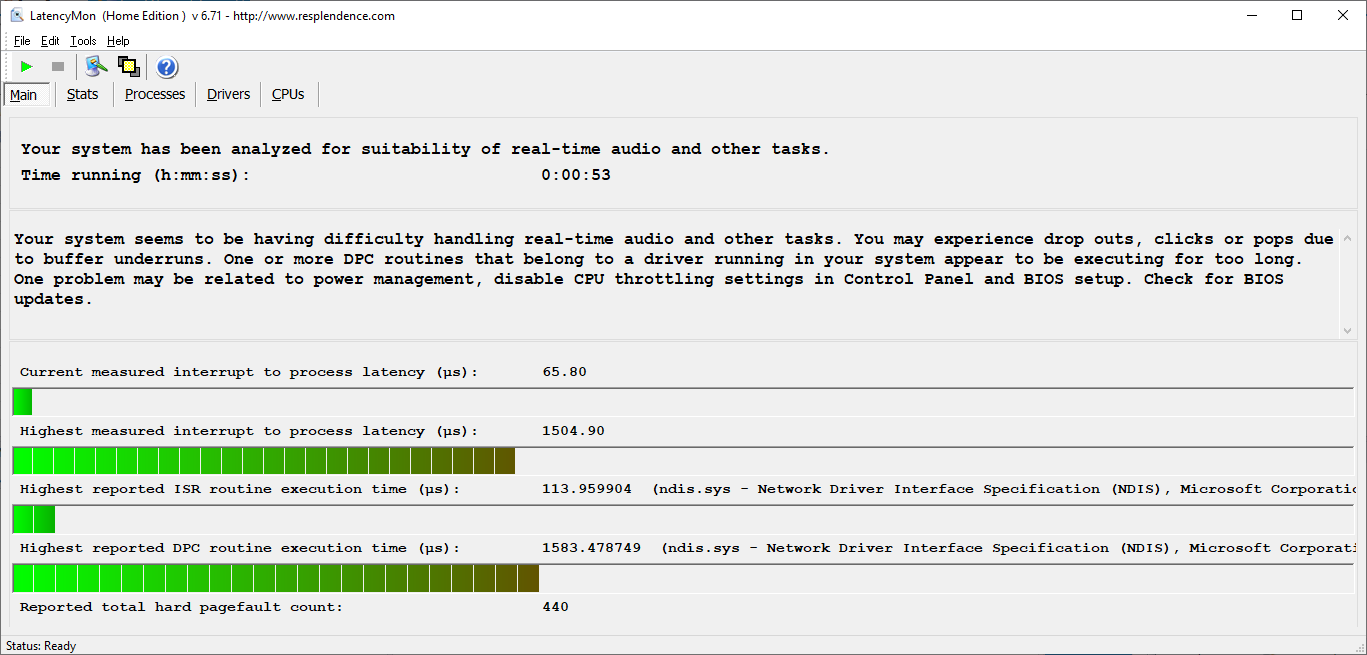
LatencyMon
Main
Text report
CONCLUSION
Your system seems to be having difficulty handling real-time audio and other tasks. You may experience drop outs, clicks or pops due to buffer underruns. One or more DPC routines that belong to a driver running in your system appear to be executing for too long. One problem may be related to power management, disable CPU throttling settings in Control Panel and BIOS setup. Check for BIOS updates.
LatencyMon has been analyzing your system for 0:00:53 (h:mm:ss) on all processors.
SYSTEM INFORMATION
Computer name: ME08
OS version: Windows 10 , 10.0, version 1903, build: 18362 (x64)
Hardware: Alienware 17, Alienware, 0MPYM4
CPU: GenuineIntel Intel® Core™ i7-4710MQ CPU @ 2.50GHz
Logical processors: 8
Processor groups: 1
RAM: 16265 MB total
CPU SPEED
Reported CPU speed: 2494 MHz
Note: reported execution times may be calculated based on a fixed reported CPU speed. Disable variable speed settings like Intel Speed Step and AMD Cool N Quiet in the BIOS setup for more accurate results.
WARNING: the CPU speed that was measured is only a fraction of the CPU speed reported. Your CPUs may be throttled back due to variable speed settings and thermal issues. It is suggested that you run a utility which reports your actual CPU frequency and temperature.
MEASURED INTERRUPT TO USER PROCESS LATENCIES
The interrupt to process latency reflects the measured interval that a usermode process needed to respond to a hardware request from the moment the interrupt service routine started execution. This includes the scheduling and execution of a DPC routine, the signaling of an event and the waking up of a usermode thread from an idle wait state in response to that event.
Highest measured interrupt to process latency (µs): 1504.90
Average measured interrupt to process latency (µs): 19.472324
Highest measured interrupt to DPC latency (µs): 1494.90
Average measured interrupt to DPC latency (µs): 13.693991
REPORTED ISRs
Interrupt service routines are routines installed by the OS and device drivers that execute in response to a hardware interrupt signal.
Highest ISR routine execution time (µs): 113.959904
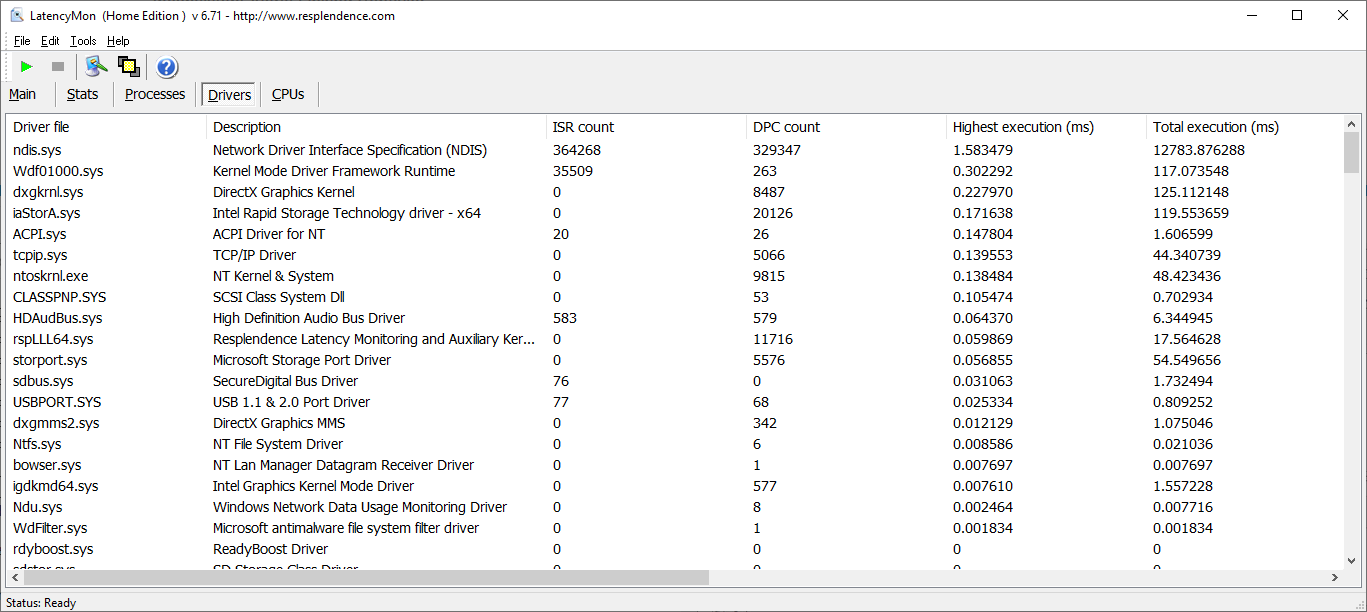
Driver with highest ISR routine execution time: ndis.sys - Network Driver Interface Specification (NDIS), Microsoft Corporation
Highest reported total ISR routine time (%): 0.306606
Driver with highest ISR total time: ndis.sys - Network Driver Interface Specification (NDIS), Microsoft Corporation
Total time spent in ISRs (%) 0.331768
ISR count (execution time <250 µs): 400533
ISR count (execution time 250-500 µs): 0
ISR count (execution time 500-999 µs): 0
ISR count (execution time 1000-1999 µs): 0
ISR count (execution time 2000-3999 µs): 0
ISR count (execution time >=4000 µs): 0
REPORTED DPCs
DPC routines are part of the interrupt servicing dispatch mechanism and disable the possibility for a process to utilize the CPU while it is interrupted until the DPC has finished execution.
Highest DPC routine execution time (µs): 1583.478749
Driver with highest DPC routine execution time: ndis.sys - Network Driver Interface Specification (NDIS), Microsoft Corporation
Highest reported total DPC routine time (%): 2.705536
Driver with highest DPC total execution time: ndis.sys - Network Driver Interface Specification (NDIS), Microsoft Corporation
Total time spent in DPCs (%) 2.807986
DPC count (execution time <250 µs): 391774
DPC count (execution time 250-500 µs): 0
DPC count (execution time 500-999 µs): 275
DPC count (execution time 1000-1999 µs): 8
DPC count (execution time 2000-3999 µs): 0
DPC count (execution time >=4000 µs): 0
REPORTED HARD PAGEFAULTS
Hard pagefaults are events that get triggered by making use of virtual memory that is not resident in RAM but backed by a memory mapped file on disk. The process of resolving the hard pagefault requires reading in the memory from disk while the process is interrupted and blocked from execution.
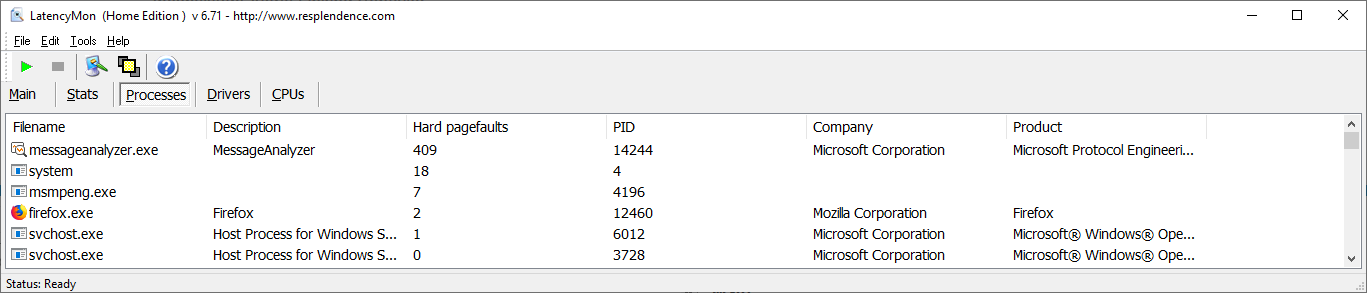
NOTE: some processes were hit by hard pagefaults. If these were programs producing audio, they are likely to interrupt the audio stream resulting in dropouts, clicks and pops. Check the Processes tab to see which programs were hit.
Process with highest pagefault count: messageanalyzer.exe
Total number of hard pagefaults 440
Hard pagefault count of hardest hit process: 409
Number of processes hit: 5
PER CPU DATA
CPU 0 Interrupt cycle time (s): 14.782769
CPU 0 ISR highest execution time (µs): 113.959904
CPU 0 ISR total execution time (s): 1.399446
CPU 0 ISR count: 399788
CPU 0 DPC highest execution time (µs): 1583.478749
CPU 0 DPC total execution time (s): 11.606116
CPU 0 DPC count: 350258
CPU 1 Interrupt cycle time (s): 0.544429
CPU 1 ISR highest execution time (µs): 77.085004
CPU 1 ISR total execution time (s): 0.002034
CPU 1 ISR count: 149
CPU 1 DPC highest execution time (µs): 105.149960
CPU 1 DPC total execution time (s): 0.104512
CPU 1 DPC count: 12789
CPU 2 Interrupt cycle time (s): 0.473912
CPU 2 ISR highest execution time (µs): 88.546913
CPU 2 ISR total execution time (s): 0.002221
CPU 2 ISR count: 174
CPU 2 DPC highest execution time (µs): 134.056937
CPU 2 DPC total execution time (s): 0.109732
CPU 2 DPC count: 16226
CPU 3 Interrupt cycle time (s): 0.257482
CPU 3 ISR highest execution time (µs): 54.097835
CPU 3 ISR total execution time (s): 0.003411
CPU 3 ISR count: 306
CPU 3 DPC highest execution time (µs): 138.938252
CPU 3 DPC total execution time (s): 0.012819
CPU 3 DPC count: 2072
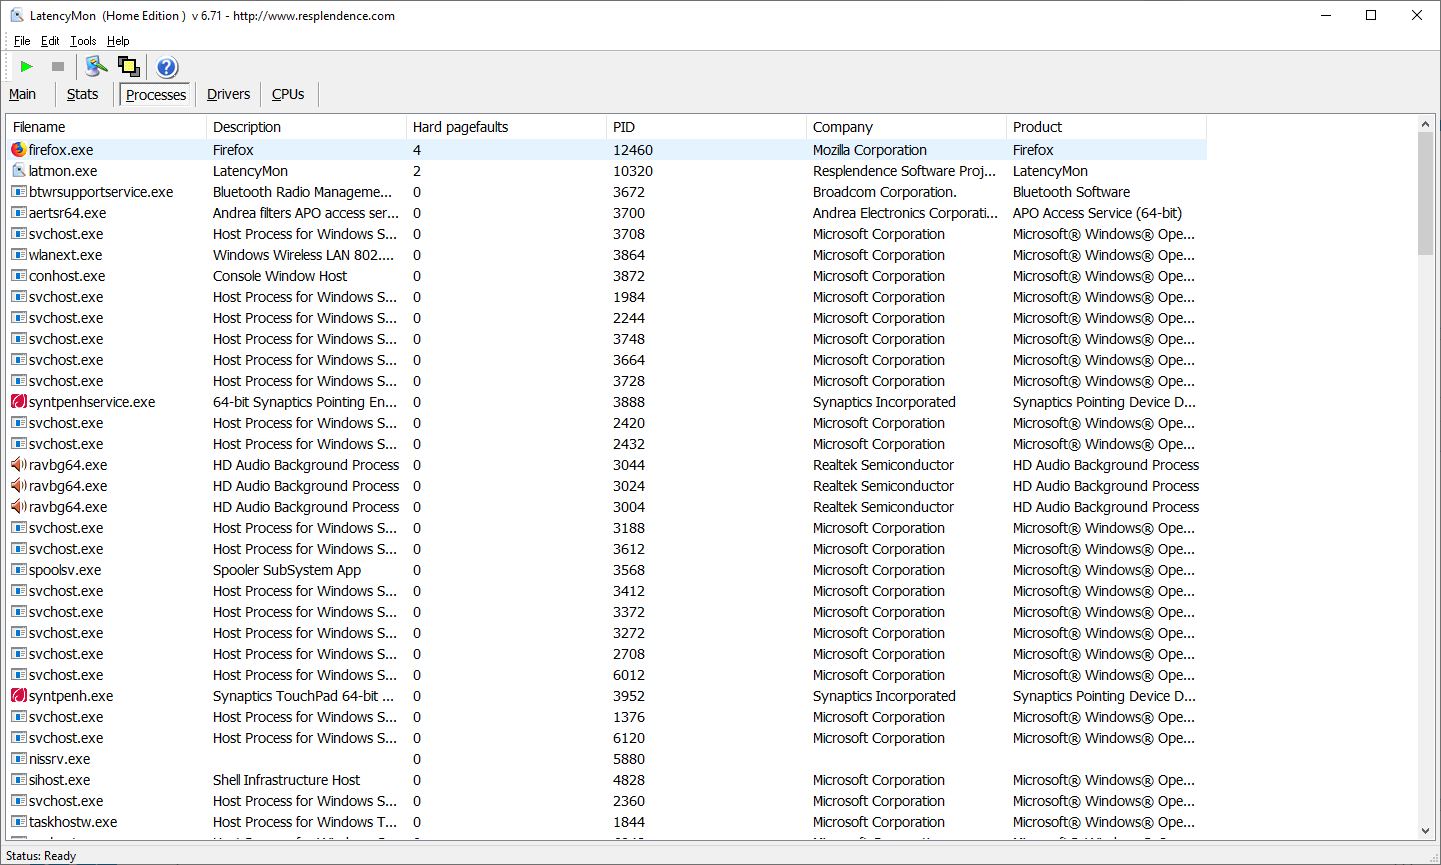
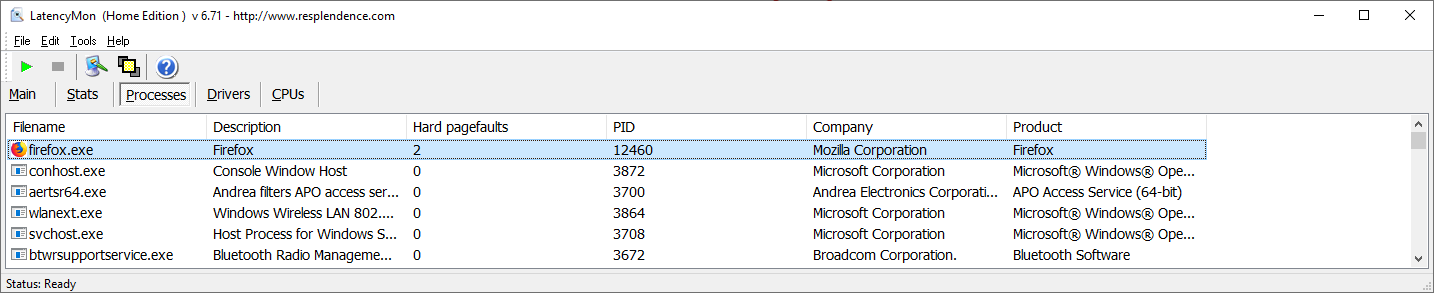
Processes
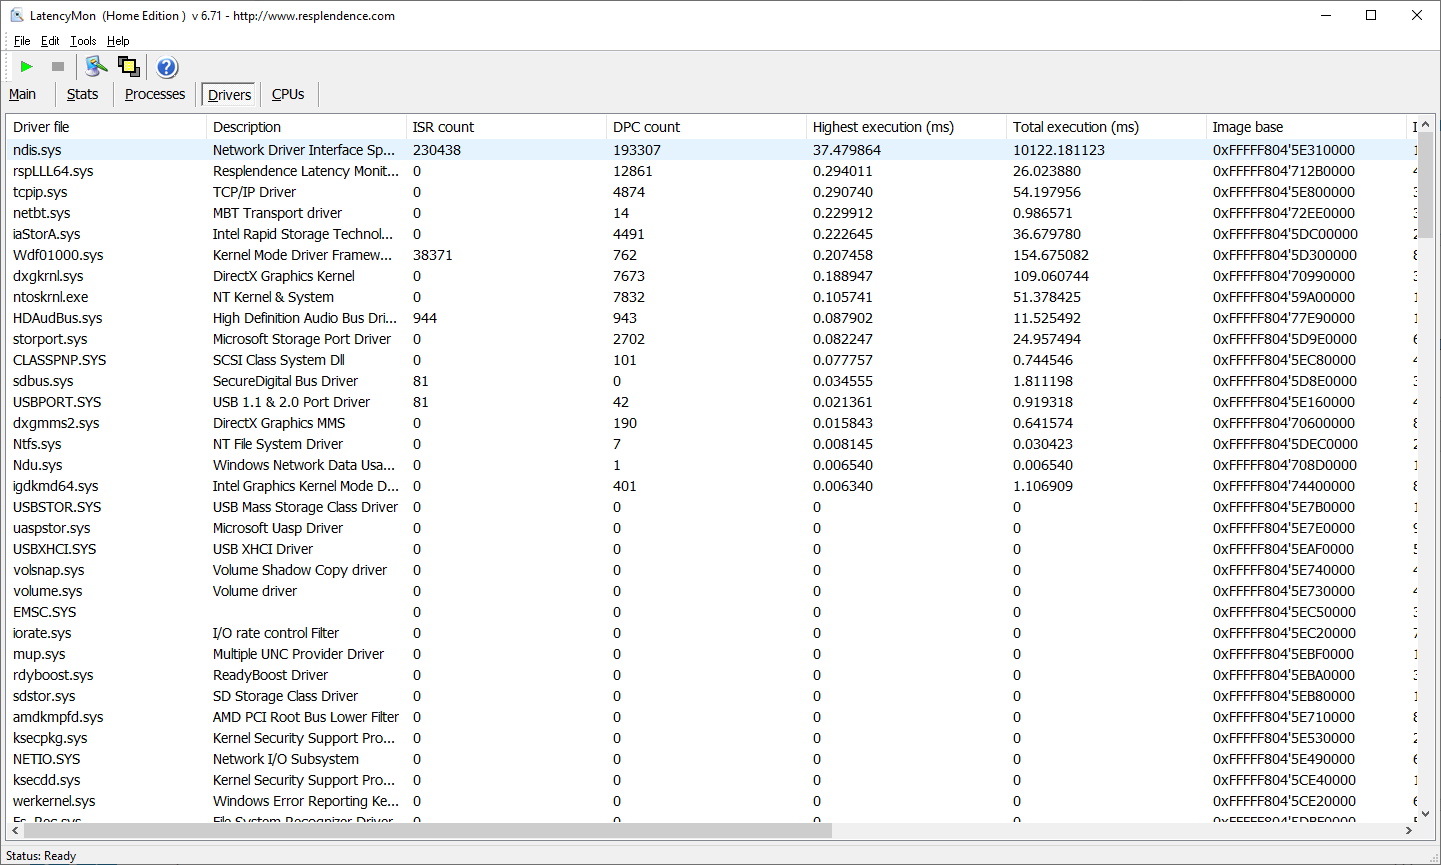
Drivers
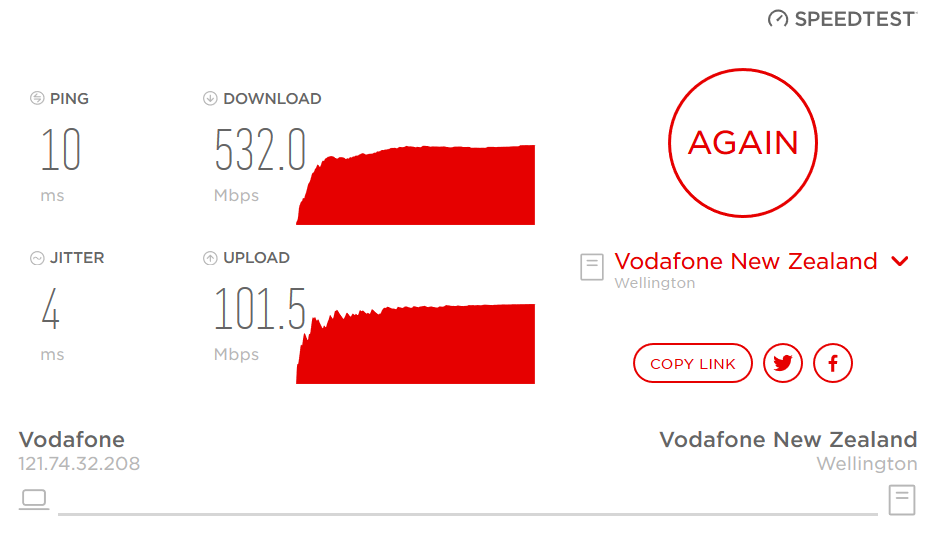
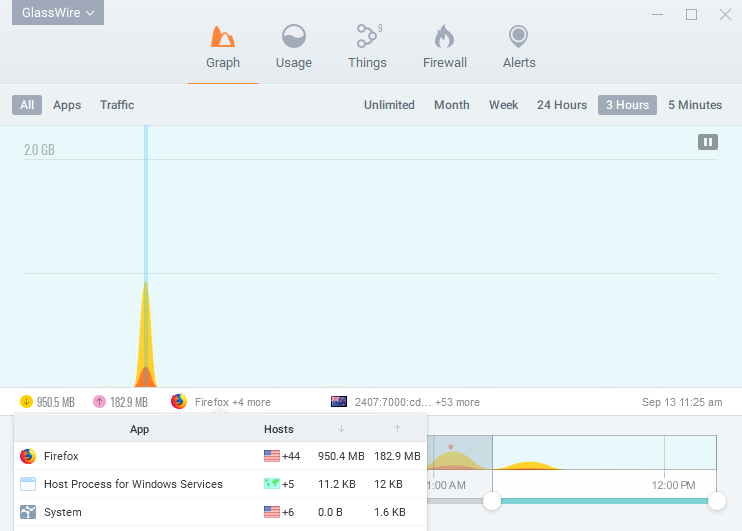
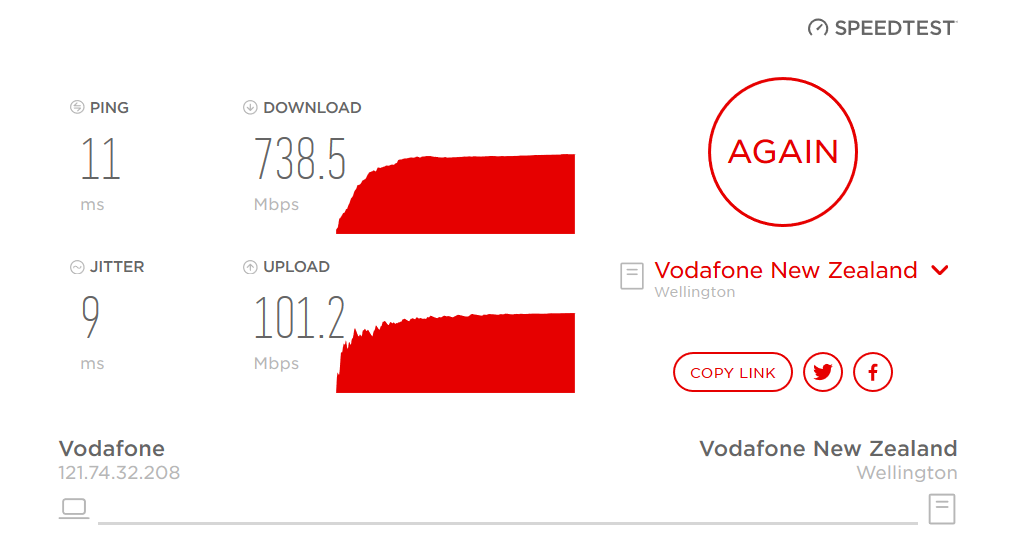
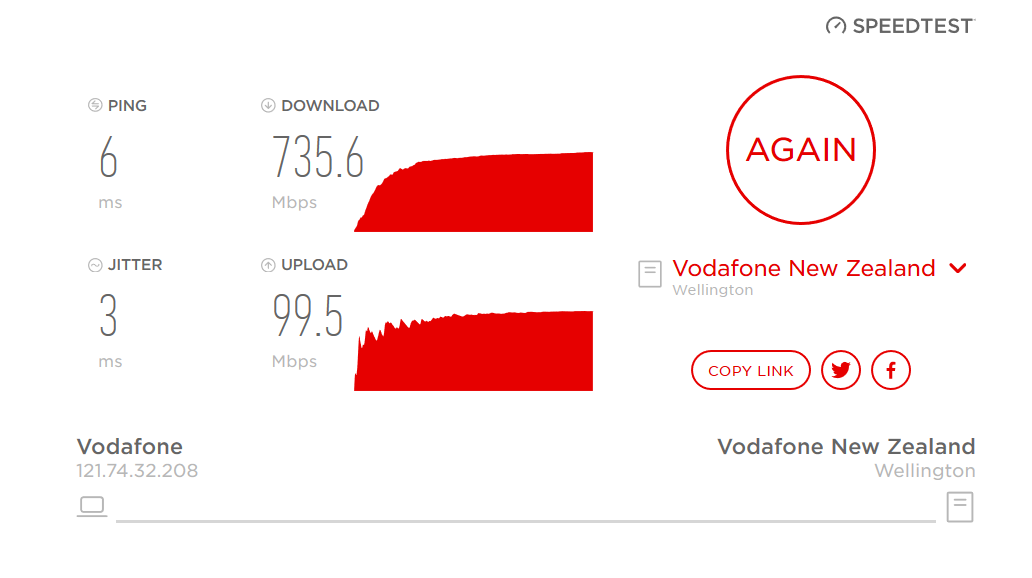
Scenario 0 - Speed test with GlassWire running
Speed test
Compared with GlassWire not running
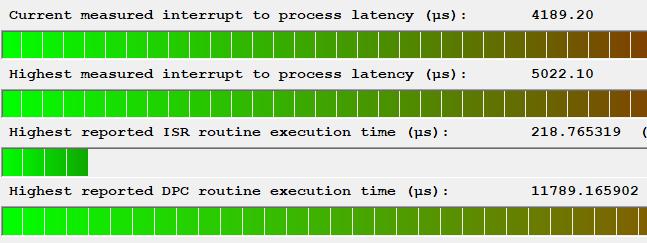
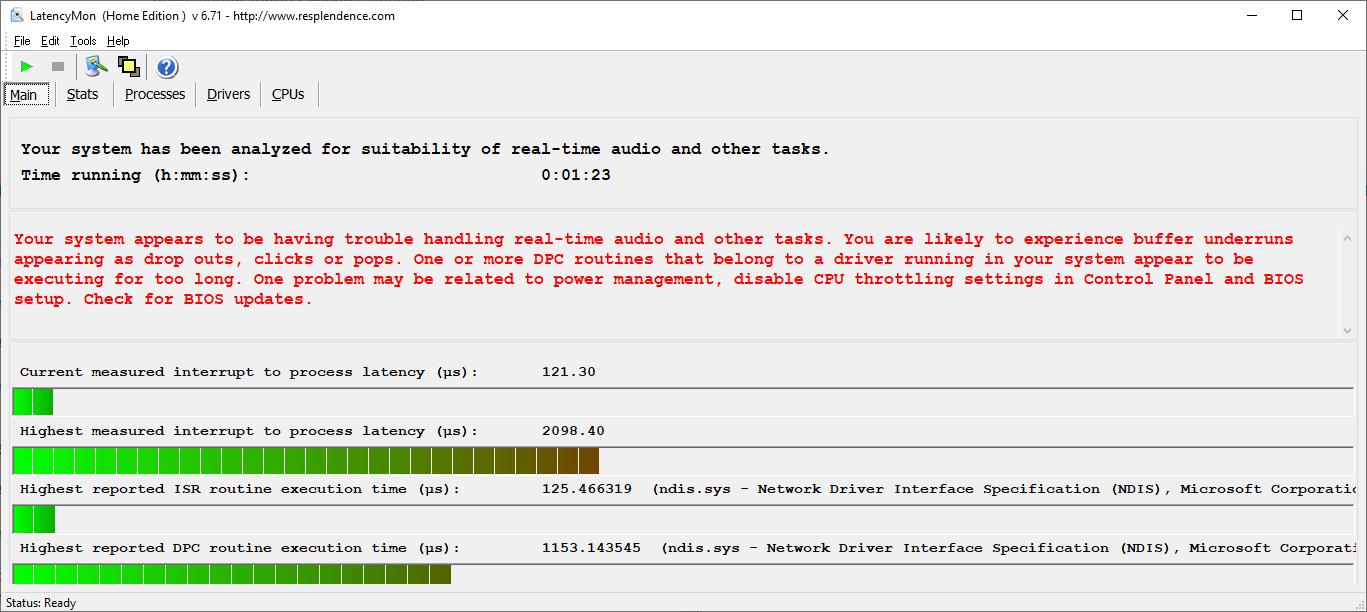
LatencyMon
Main
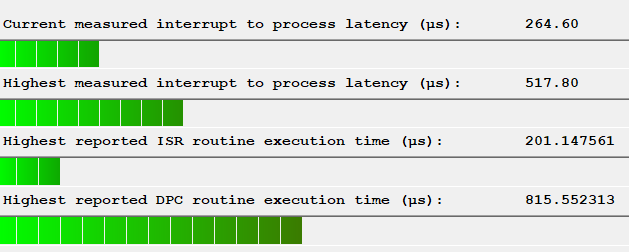
Stats
Summary
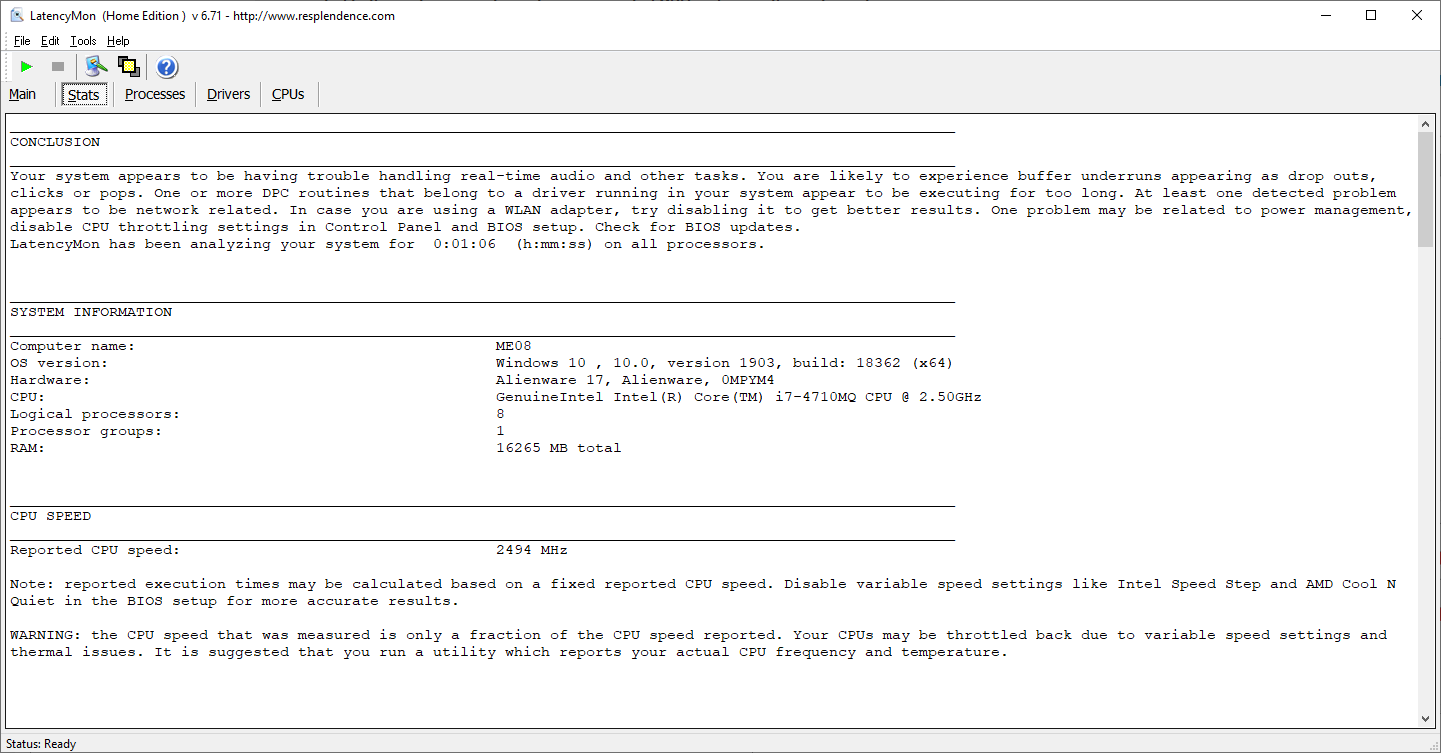
CONCLUSION
Your system appears to be having trouble handling real-time audio and other tasks. You are likely to experience buffer underruns appearing as drop outs, clicks or pops. One or more DPC routines that belong to a driver running in your system appear to be executing for too long. One problem may be related to power management, disable CPU throttling settings in Control Panel and BIOS setup. Check for BIOS updates.
LatencyMon has been analyzing your system for 0:01:23 (h:mm:ss) on all processors.
SYSTEM INFORMATION
Computer name: ME08
OS version: Windows 10 , 10.0, version 1903, build: 18362 (x64)
Hardware: Alienware 17, Alienware, 0MPYM4
CPU: GenuineIntel Intel® Core™ i7-4710MQ CPU @ 2.50GHz
Logical processors: 8
Processor groups: 1
RAM: 16265 MB total
CPU SPEED
Reported CPU speed: 2494 MHz
Note: reported execution times may be calculated based on a fixed reported CPU speed. Disable variable speed settings like Intel Speed Step and AMD Cool N Quiet in the BIOS setup for more accurate results.
WARNING: the CPU speed that was measured is only a fraction of the CPU speed reported. Your CPUs may be throttled back due to variable speed settings and thermal issues. It is suggested that you run a utility which reports your actual CPU frequency and temperature.
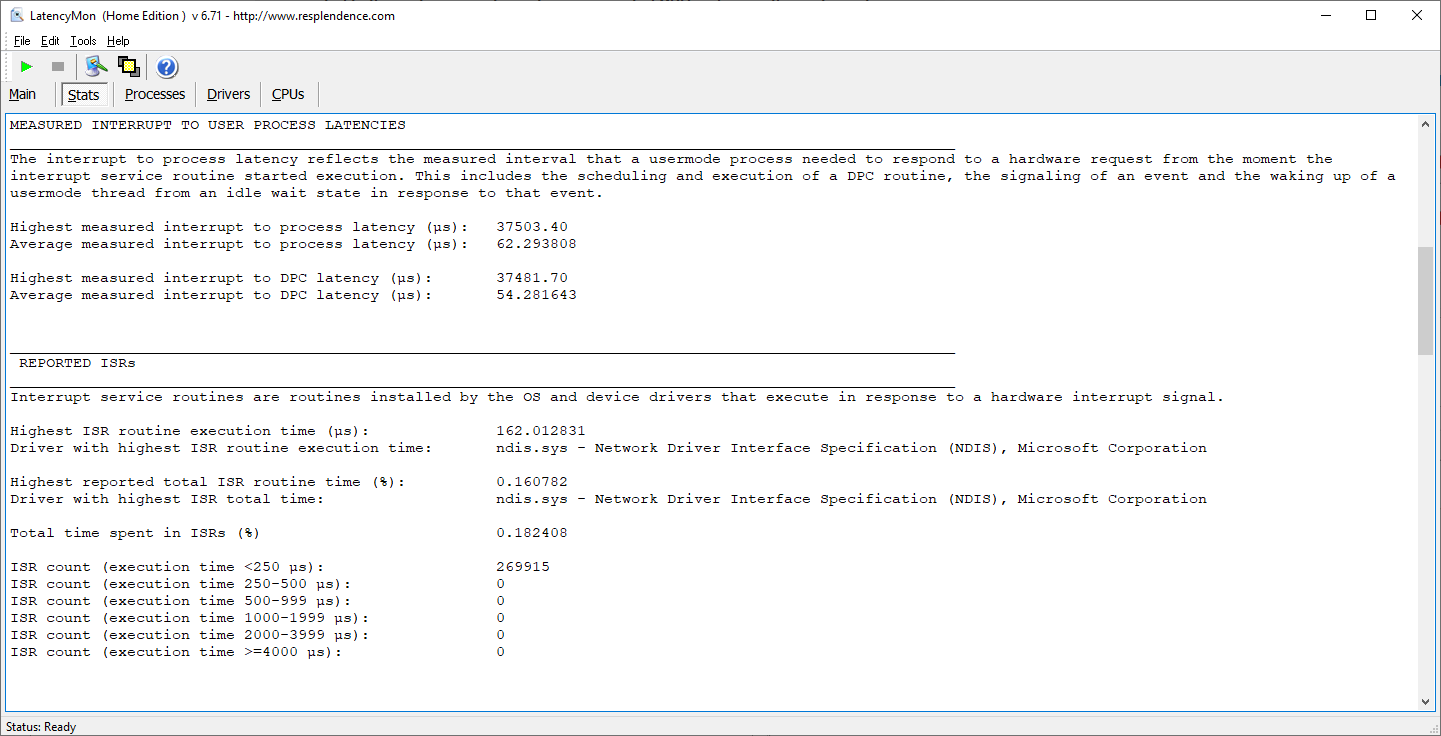
MEASURED INTERRUPT TO USER PROCESS LATENCIES
The interrupt to process latency reflects the measured interval that a usermode process needed to respond to a hardware request from the moment the interrupt service routine started execution. This includes the scheduling and execution of a DPC routine, the signaling of an event and the waking up of a usermode thread from an idle wait state in response to that event.
Highest measured interrupt to process latency (µs): 2098.40
Average measured interrupt to process latency (µs): 17.063021
Highest measured interrupt to DPC latency (µs): 2093.50
Average measured interrupt to DPC latency (µs): 8.979410
REPORTED ISRs
Interrupt service routines are routines installed by the OS and device drivers that execute in response to a hardware interrupt signal.
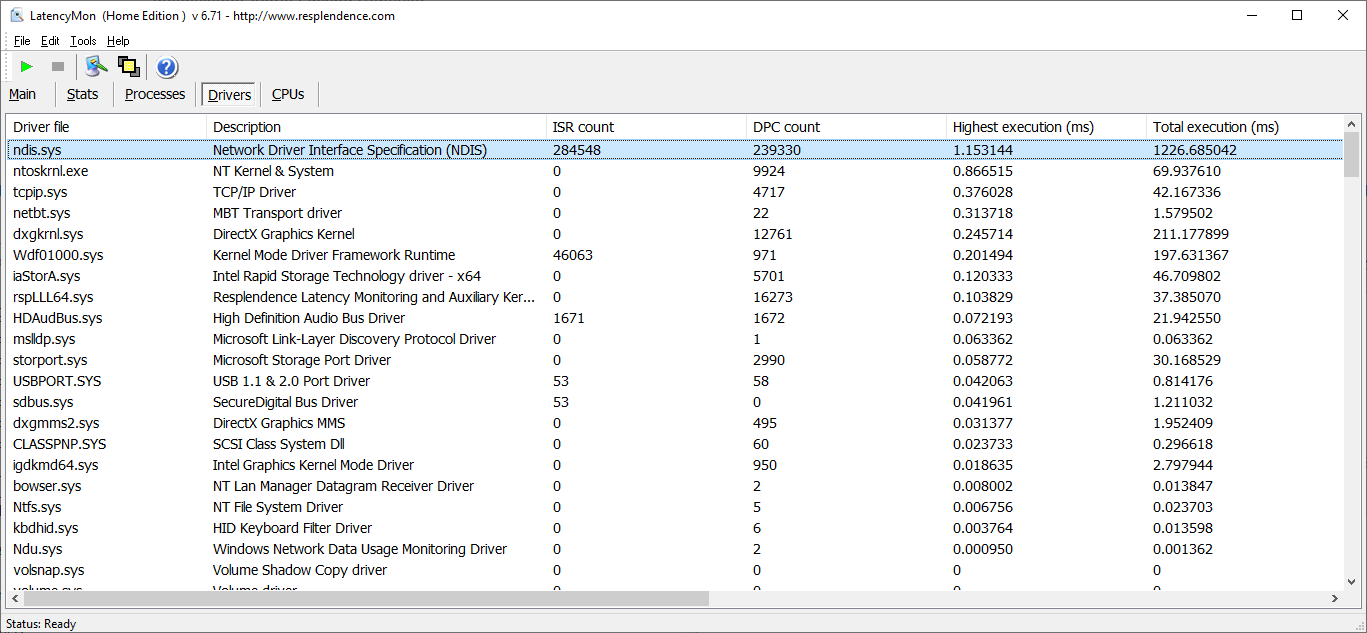
Highest ISR routine execution time (µs): 125.466319
Driver with highest ISR routine execution time: ndis.sys - Network Driver Interface Specification (NDIS), Microsoft Corporation
Highest reported total ISR routine time (%): 0.147704
Driver with highest ISR total time: ndis.sys - Network Driver Interface Specification (NDIS), Microsoft Corporation
Total time spent in ISRs (%) 0.168421
ISR count (execution time <250 µs): 332388
ISR count (execution time 250-500 µs): 0
ISR count (execution time 500-999 µs): 0
ISR count (execution time 1000-1999 µs): 0
ISR count (execution time 2000-3999 µs): 0
ISR count (execution time >=4000 µs): 0
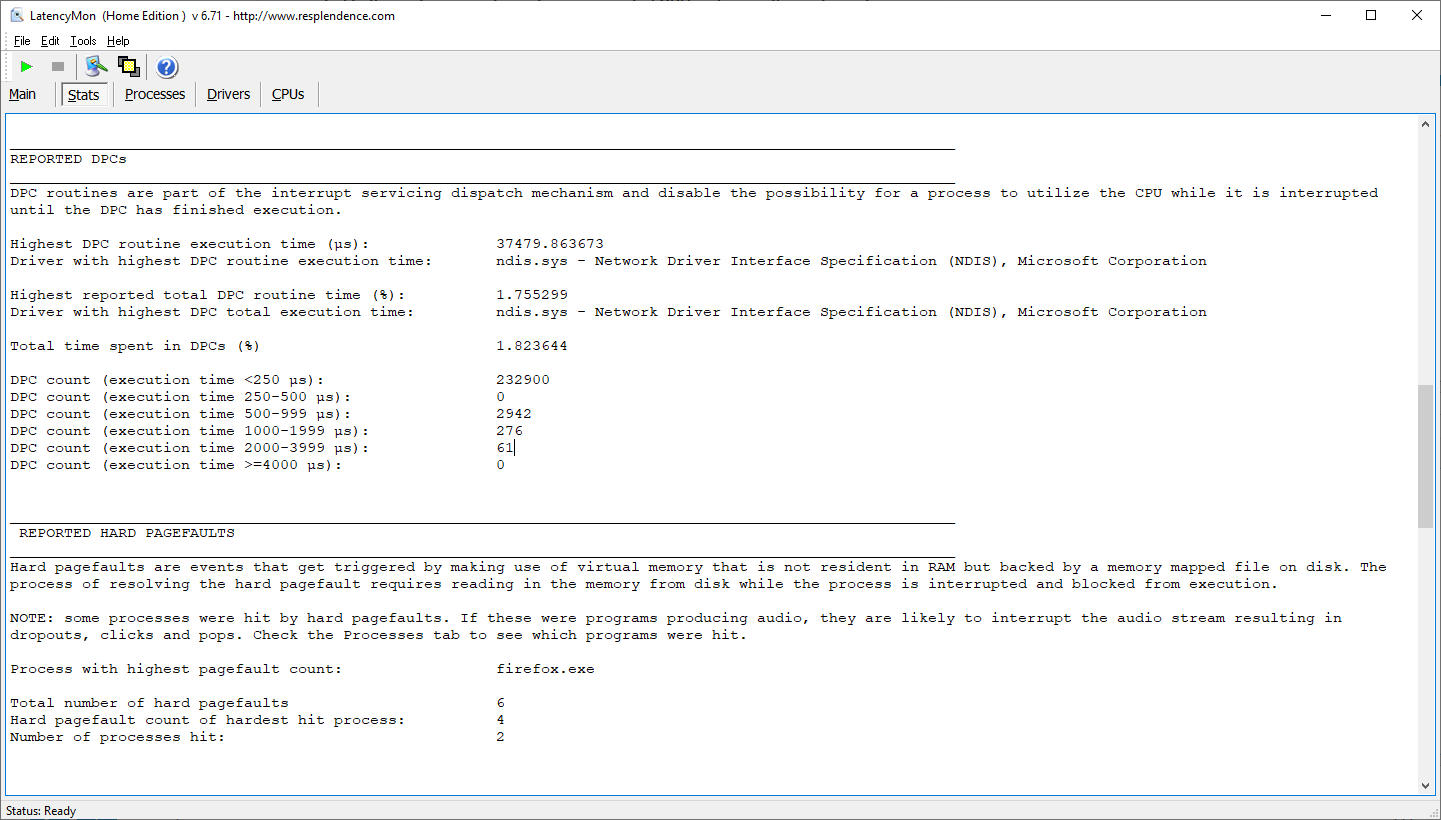
REPORTED DPCs
DPC routines are part of the interrupt servicing dispatch mechanism and disable the possibility for a process to utilize the CPU while it is interrupted until the DPC has finished execution.
Highest DPC routine execution time (µs): 1153.143545
Driver with highest DPC routine execution time: ndis.sys - Network Driver Interface Specification (NDIS), Microsoft Corporation
Highest reported total DPC routine time (%): 0.033806
Driver with highest DPC total execution time: ndis.sys - Network Driver Interface Specification (NDIS), Microsoft Corporation
Total time spent in DPCs (%) 0.116231
DPC count (execution time <250 µs): 295912
DPC count (execution time 250-500 µs): 0
DPC count (execution time 500-999 µs): 27
DPC count (execution time 1000-1999 µs): 1
DPC count (execution time 2000-3999 µs): 0
DPC count (execution time >=4000 µs): 0
REPORTED HARD PAGEFAULTS
Hard pagefaults are events that get triggered by making use of virtual memory that is not resident in RAM but backed by a memory mapped file on disk. The process of resolving the hard pagefault requires reading in the memory from disk while the process is interrupted and blocked from execution.
NOTE: some processes were hit by hard pagefaults. If these were programs producing audio, they are likely to interrupt the audio stream resulting in dropouts, clicks and pops. Check the Processes tab to see which programs were hit.
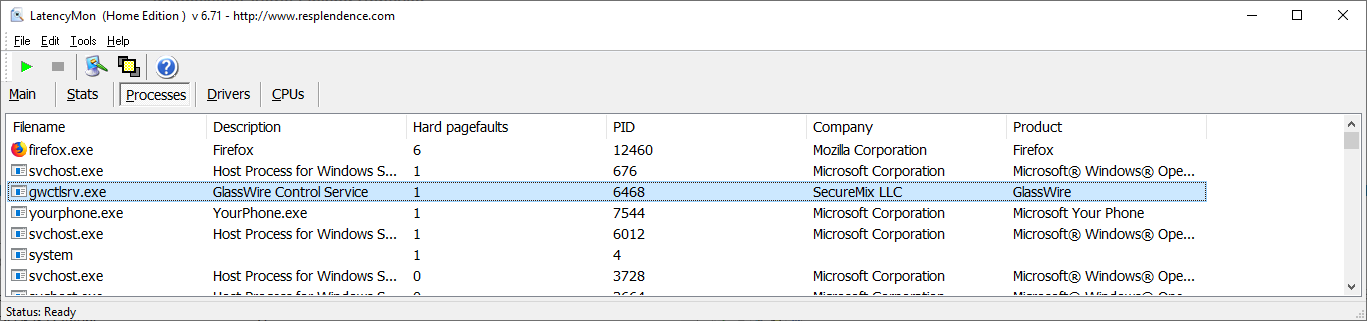
Process with highest pagefault count: firefox.exe
Total number of hard pagefaults 11
Hard pagefault count of hardest hit process: 6
Number of processes hit: 6
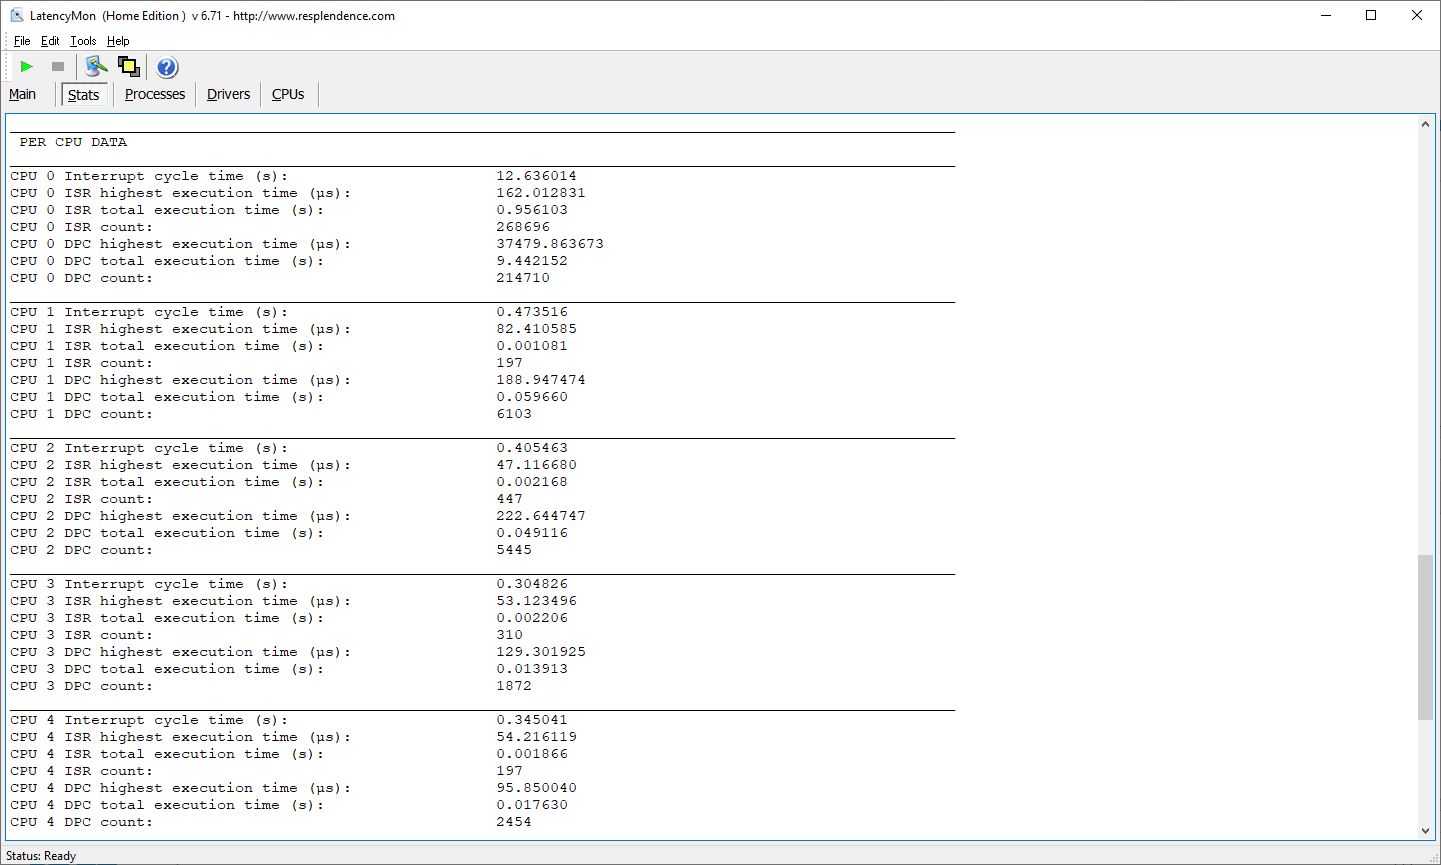
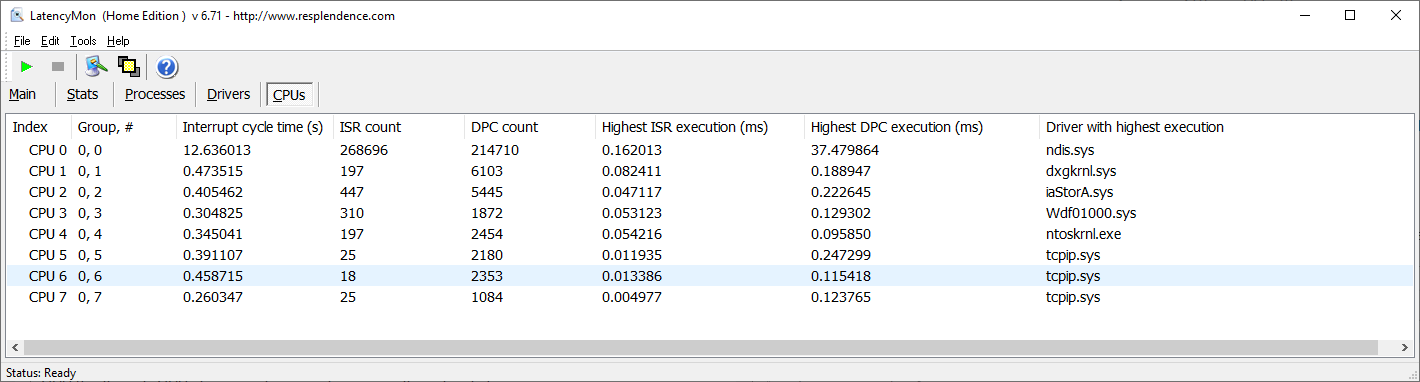
PER CPU DATA
CPU 0 Interrupt cycle time (s): 3.252233
CPU 0 ISR highest execution time (µs): 125.466319
CPU 0 ISR total execution time (s): 1.108349
CPU 0 ISR count: 330361
CPU 0 DPC highest execution time (µs): 1153.143545
CPU 0 DPC total execution time (s): 0.609303
CPU 0 DPC count: 276858
CPU 1 Interrupt cycle time (s): 0.546852
CPU 1 ISR highest execution time (µs): 63.308741
CPU 1 ISR total execution time (s): 0.010848
CPU 1 ISR count: 1863
CPU 1 DPC highest execution time (µs): 245.713713
CPU 1 DPC total execution time (s): 0.053786
CPU 1 DPC count: 5832
CPU 2 Interrupt cycle time (s): 0.604561
CPU 2 ISR highest execution time (µs): 15.289094
CPU 2 ISR total execution time (s): 0.000249
CPU 2 ISR count: 66
CPU 2 DPC highest execution time (µs): 866.514836
CPU 2 DPC total execution time (s): 0.039609
CPU 2 DPC count: 4187
CPU 3 Interrupt cycle time (s): 0.384163
CPU 3 ISR highest execution time (µs): 5.357658
CPU 3 ISR total execution time (s): 0.000057
CPU 3 ISR count: 21
CPU 3 DPC highest execution time (µs): 78.032077
CPU 3 DPC total execution time (s): 0.007104
CPU 3 DPC count: 1042
Processes
Drivers