I don’t look at the Graph view very often so it took me months to notice that syncing had started copying my entire Outlook .PST file every time it changed. The outlook.pst file was a huge number of emails because the 1.3GB file size was mainly text/html as I save photos and other large files elsewhere. This is not too large considering that Outlook can handle 50GB files but the syncing “problem” was basically wasting bandwidth.
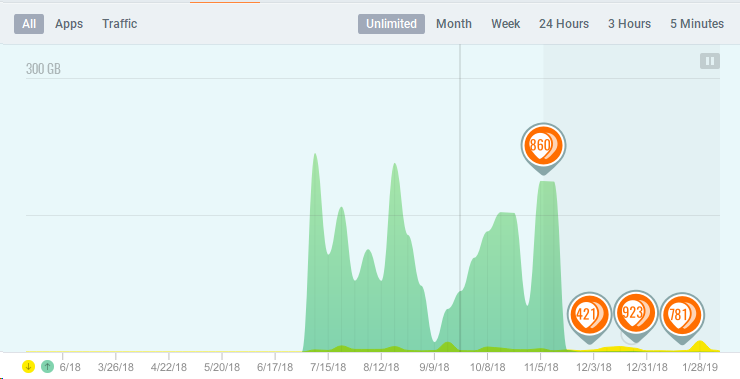
I decided to blitz my stored emails. I cleaned out so many that I’ve now only got a hundred or so. I didn’t actually do this to reduce bandwidth but the result is obvious in the graph. My ISP would be happy I did this but as I’m on an unlimited data plan there wasn’t any cost benefit to me.
I only have seven months history because, although I’ve used GlassWire since the earliest versions, I keep resetting GlassWire to try out new features or to try reproduce bugs.
That looks cool and that’s interesting about the Outlook .PST file!
Below is a screenshot from one of our first users who detected malware his antivirus had missed. It is always one of my favorite graphs although it’s not “unlimited”. I actually just did a clean install of GlassWire as I’m testing some new features otherwise I’d post my latest graph too!
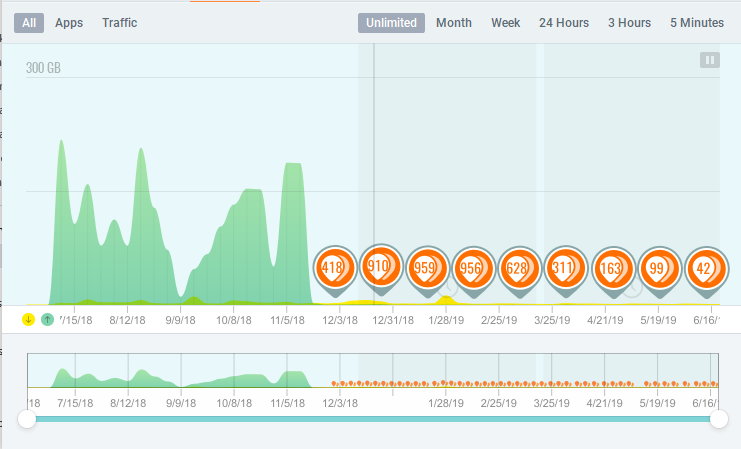
At present the balloons are visible for about three months. My last one is exactly 3 months ago on November 11 2018. I don’t remember them ever extending to more than three months (at least for the last three years) but I could be wrong.
By the way, you can see that the balloons only appear in a shaded areathe area that contains shading in the Unlimited Graph view. Right now that shaded area is about 95 days for me which is slightly longer so maybe the balloons are visible for slightly more than three months.
The shading indicates time away from the computer so many of us will see continuous shading in the Unlimited Graph view. In your graph you have larger gaps which I guess means that either you spend a lot more time on your computer, that you have some software simulating mouse or keyboard input, or that you have set Begin idle mode in x minutes to much more than the 5 minute default.
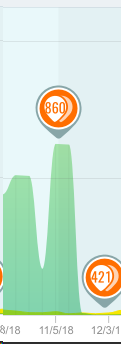
To illustrate the transition to shading, I’ve copied a section of my original graph above:
Maybe is about the old topic: graph looks differently on different resolution. My screen is kind of high dpi compared to average. Here is a different view without maximize the window. The big gaps is the time that I wan’t using this computer.
Before December did you have all security alerts disabled, or what is the reason for no balloons previously? I am not sure I understand what happened. Is it a bug?
I was commenting that it looks strange because my usage drops so abruptly so I can’t see any real detail since 15 November. But the balloons are just as strange and it probably is a bug that the event balloons don’t appear on the entire graph. This problem has been reported before:
Like @csdfg2, I used to have the balloons appear for more of the graph when I restarted GlassWire but the balloons would quickly disappear for dates more than about six months ago.
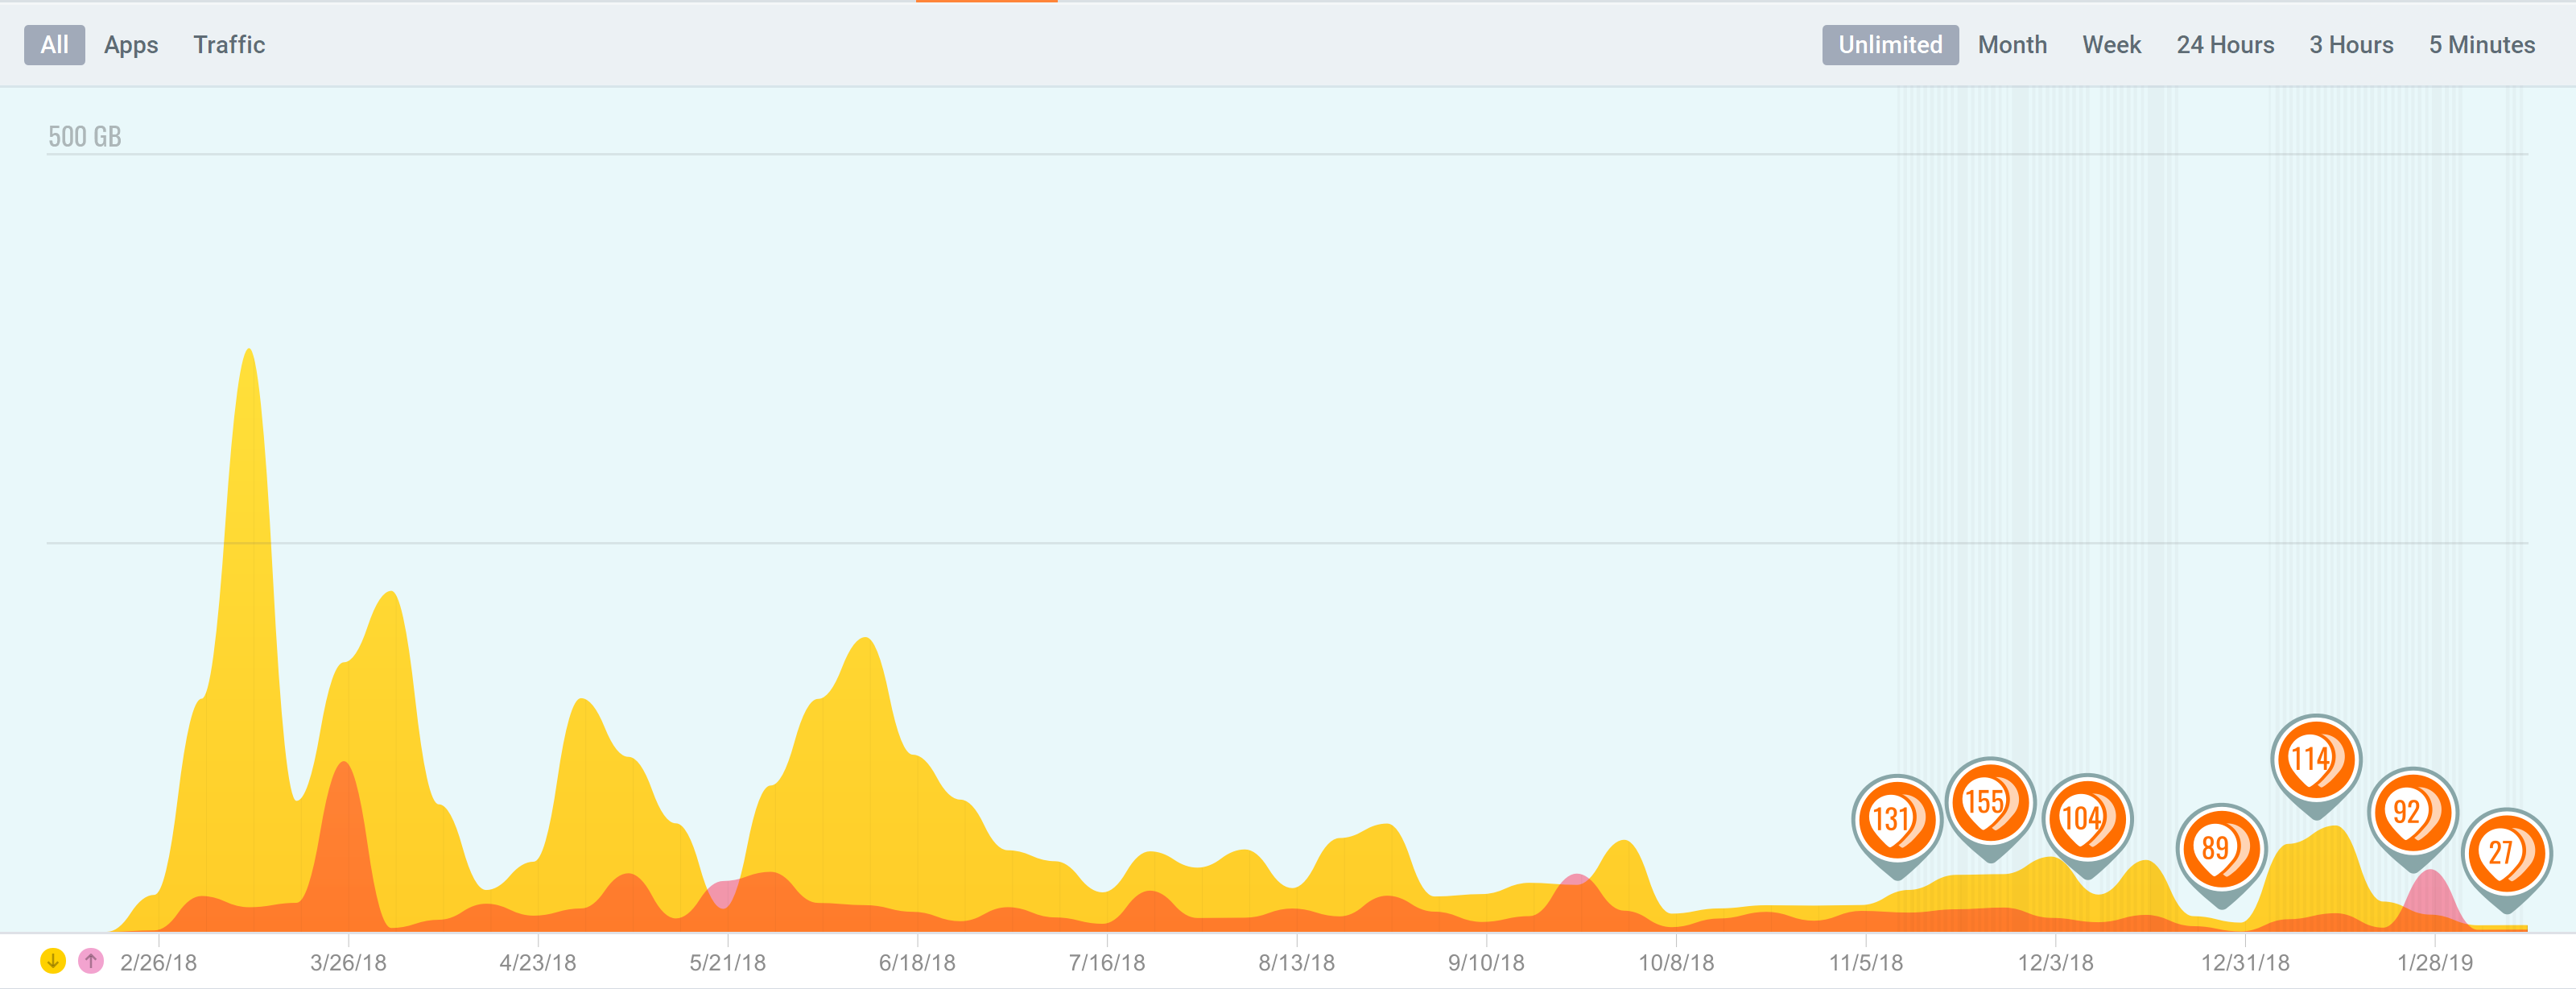
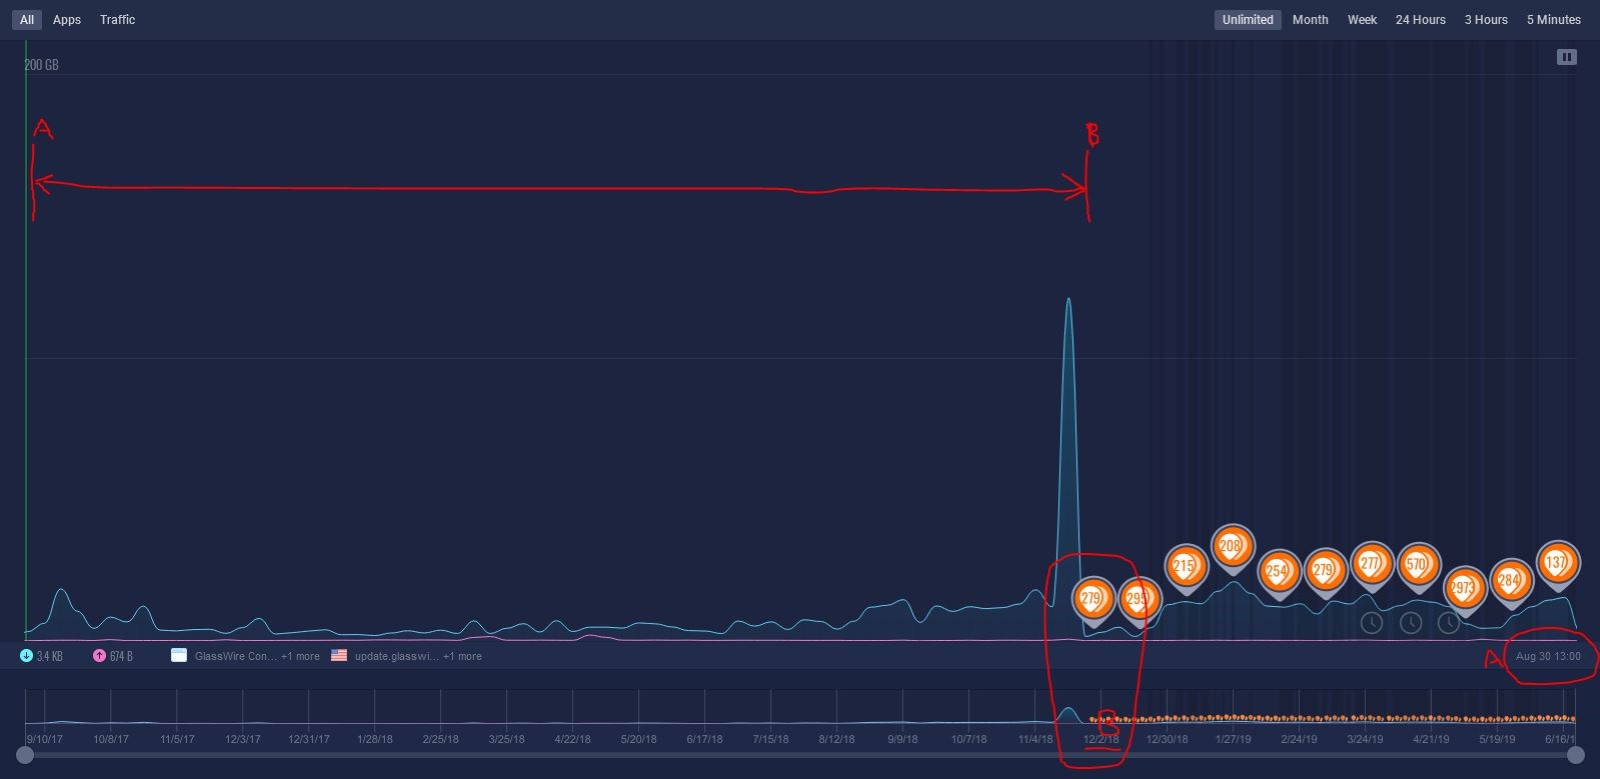
My Unlimited Graph view is similar to yours (Unlimited_1.jpg). Since the GW 2.1.158 update, I now have all of my data usage displayed back to 08/30/2017 (“A”), when I started with a fresh GW database. (I positioned the cursor at the left edge to display the starting date at the far right of the Graph.) However, Alert event balloons are still only displayed since early December until today’s date. The earliest Alert event entries on the Alerts Tab of GW are dated 11/28/2018 (“B”). That date is consistent with the earliest Alert event balloon on the Unlimited Graph display. No event balloons are displayed from points “A” to “B.”
Just came across through this post on my mobile. My graph look exactly the same as shown in beginning of this thread. With some intense drops Can someone point out the exact reason of these frops ?
Our team reviewed this. We had a bug where very old alerts were deleted. This issue is fixed going forward but we have no way to fix this for people it already happened to.
@davidmichaels About your question, you would have to answer this yourself. Perhaps this was a major Windows update that caused a lot of network activity or something like that. You can also click on the graph and see what exactly caused the activity via app or traffic type, or host.
So, if I understand you correctly, you are saying that my Alert events prior to 11/28/2018 were deleted from the GW database as the result of a bug, which is currently fixed? Is that fix included in the current GW 2.1.158? Or will it appear in the next release? Thanks for the help and for a very cool program!
Just to be clear, the GlassWire database for every GlassWire user is only stored locally on the user’s PC. We can never access it or see it.
I am not sure if the data was deleted or if there was an issue with showing the data (that still exists somehow) when we switched to a different database format. I will try to find out. Sorry for the issue.
Hi Ken,
Thanks for the clarification. I do understand that all of my GW data is stored on my own machine, locally. I wondered if you were saying that the Alert events which are not being displayed were indeed deleted from my local data along the way, due to a bug, or if the Alert events still exist in the DB but are just not being displayed currently, due to a bug that has not yet been resolved. On the bright side, it is nice to be able to see and explore the programs and hosts going back to 2017, now. Thank you.
 otherwise I’d post my latest graph too!
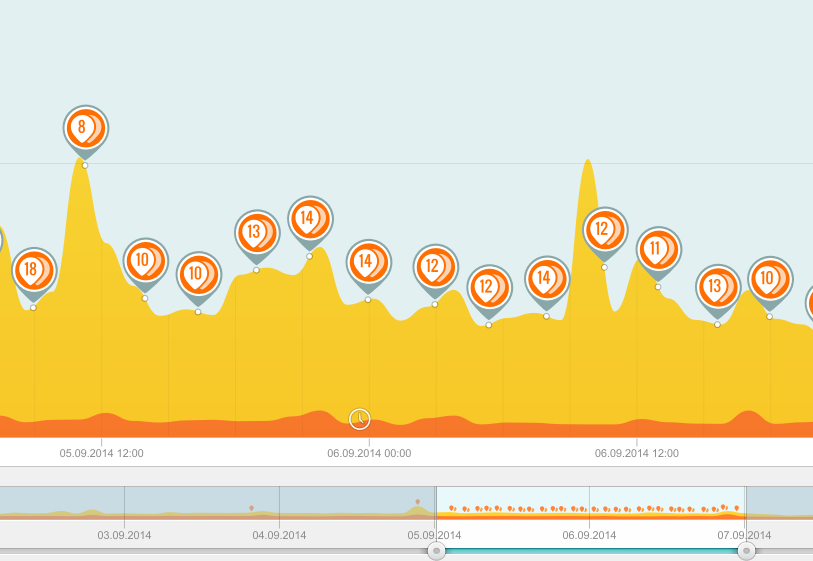

 Can someone point out the exact reason of these frops ?